Chaikin Money Flow: 2026 Indicator for 10% US Stock Moves

The Chaikin Money Flow: A 2026 Indicator for Predicting 10% US Stock Price Movements is a sophisticated volume-based oscillator designed to measure buying and selling pressure over a specified period, potentially signaling future price shifts.
Have you ever wondered if there’s a secret to anticipating significant shifts in the stock market? In the dynamic world of trading, understanding the underlying forces of accumulation and distribution is paramount. The Chaikin Money Flow: A 2026 Indicator for Predicting 10% US Stock Price Movements emerges as a compelling tool, offering a glimpse into the potential for substantial gains or losses. This article delves into how this indicator could be a game-changer for your investment strategy by 2026.
Understanding the Chaikin Money Flow (CMF) Basics
The Chaikin Money Flow (CMF) is a technical analysis indicator developed by Marc Chaikin, designed to measure the amount of money flow volume over a specific period. This indicator provides insights into the buying and selling pressure of a security, helping traders identify accumulation (buying pressure) or distribution (selling pressure).
At its core, CMF aggregates Money Flow Volume for a customizable look-back period, typically 20 or 21 days. The calculation involves several steps, starting with the Money Flow Multiplier, which considers the closing price relative to the daily high-low range. This multiplier is then combined with the day’s volume to derive the Money Flow Volume, which is ultimately summed and divided by total volume over the chosen period to produce the CMF value.
How CMF is Calculated
The CMF calculation is a multi-step process that provides a nuanced view of market sentiment. It begins by determining the Money Flow Multiplier for each period. This multiplier assesses where the closing price falls within the day’s trading range. A close near the high suggests strong buying pressure, while a close near the low indicates selling pressure.
- Money Flow Multiplier: ((Close – Low) – (High – Close)) / (High – Low)
- Money Flow Volume: Money Flow Multiplier * Volume
- Chaikin Money Flow: (21-period Sum of Money Flow Volume) / (21-period Sum of Volume)
These calculations result in an oscillator that fluctuates above and below a zero line. Positive CMF values indicate accumulation, suggesting that the stock is closing in the upper half of its daily range with increasing volume. Conversely, negative CMF values signal distribution, implying the stock is closing in the lower half of its range with significant selling volume.
In essence, the CMF provides a clear, quantitative measure of the ongoing battle between buyers and sellers. By observing its trajectory and position relative to the zero line, traders can gain a deeper understanding of the market’s underlying momentum and potentially anticipate significant price movements.
Interpreting CMF Signals for US Stock Analysis
Interpreting Chaikin Money Flow (CMF) signals is crucial for effective technical analysis, especially when aiming to predict significant movements in US stocks. The indicator’s primary function is to reveal whether a stock is under accumulation (buying pressure) or distribution (selling pressure) over a chosen period. Understanding these dynamics can provide an edge in anticipating price trends.
A key aspect of CMF interpretation revolves around its relationship with the zero line. When the CMF crosses above the zero line, it often signals increasing buying pressure and accumulation. This can be an early indication of a potential upward price trend. Conversely, a cross below the zero line suggests growing selling pressure and distribution, hinting at a possible downward trend.
Identifying Accumulation and Distribution
CMF values are particularly insightful for discerning accumulation and distribution phases. Sustained periods of CMF above the zero line suggest that the stock is consistently closing near its daily highs, accompanied by robust trading volume. This pattern indicates strong institutional interest and buying activity, which often precedes or accompanies bullish price movements.
- Positive CMF: Indicates buying pressure and accumulation, suggesting potential for price increase.
- Negative CMF: Points to selling pressure and distribution, signaling potential for price decrease.
- Cross Above Zero: A bullish signal, confirming a shift from distribution to accumulation.
- Cross Below Zero: A bearish signal, confirming a shift from accumulation to distribution.
On the other hand, a CMF that consistently stays below the zero line implies that the stock is frequently closing near its daily lows, often with high volume. This signifies persistent selling pressure and distribution, which typically precedes or coincides with bearish price action. Traders often look for these prolonged periods to confirm the strength of a trend.
Beyond the zero line, the magnitude of the CMF value also matters. A CMF reading significantly above +0.10 or below -0.10 can indicate particularly strong buying or selling pressure, respectively. These extreme readings suggest a powerful underlying force driving the stock, which can lead to more pronounced price movements. However, it’s essential to use CMF in conjunction with other indicators for confirmation, as no single indicator is infallible.
CMF in Conjunction with Other Technical Indicators
While the Chaikin Money Flow (CMF) is a powerful indicator on its own, its predictive capabilities are significantly enhanced when used in conjunction with other technical analysis tools. Combining CMF with complementary indicators can provide a more comprehensive view of market dynamics, helping to confirm signals and reduce false positives.
One common pairing is CMF with price action analysis. Observing how the CMF behaves relative to a stock’s price movements can reveal divergences that signal potential reversals. For example, if a stock’s price is making new highs, but the CMF is failing to reach new highs or even declining, it could indicate weakening buying pressure, suggesting an impending bearish reversal.
Complementary Indicators for Enhanced Analysis
Integrating CMF with other indicators allows for a multi-faceted approach to market analysis, providing stronger conviction in trading decisions. Each additional indicator offers a different perspective, helping to validate the signals generated by the CMF.
- Moving Averages (MAs): CMF can confirm trends indicated by MAs. A bullish CMF with price above a rising MA strengthens the upward trend signal.
- Relative Strength Index (RSI): CMF can validate overbought/oversold conditions identified by RSI. A low CMF when RSI indicates oversold conditions could suggest a stronger potential for a bounce.
- Bollinger Bands: CMF can help predict breakouts from Bollinger Bands. Increasing CMF as price approaches an upper band might signal an upward breakout.
- MACD (Moving Average Convergence Divergence): CMF can confirm MACD crossovers. A bullish CMF coinciding with a MACD bullish crossover provides a stronger buy signal.
Volume indicators, such as On-Balance Volume (OBV), also pair well with CMF. While both measure money flow, they do so with different methodologies. OBV focuses on whether volume on up days exceeds volume on down days, while CMF considers the closing price’s position within the daily range. A confluence of bullish signals from both CMF and OBV can provide robust confirmation of an accumulation phase.
Ultimately, the goal of combining CMF with other indicators is to build a more robust trading strategy. By cross-referencing signals, traders can filter out noise and focus on high-probability setups, increasing their chances of identifying significant price movements and making more informed decisions in the US stock market.
Predicting 10% US Stock Price Movements by 2026
The aspiration to predict significant stock price movements is a constant in financial markets. With the year 2026 on the horizon, leveraging indicators like the Chaikin Money Flow (CMF) for anticipating 10% US stock price shifts becomes particularly relevant. While no indicator offers guaranteed predictions, CMF provides a valuable framework for identifying stocks with strong underlying accumulation or distribution, which are often precursors to substantial price changes.
To effectively predict 10% movements, traders often look for prolonged and consistent CMF readings. A sustained CMF above +0.20, for example, could indicate very strong buying pressure that, if continued, could fuel a significant upward rally. Conversely, a persistent CMF below -0.20 might suggest intense selling pressure leading to a notable decline.
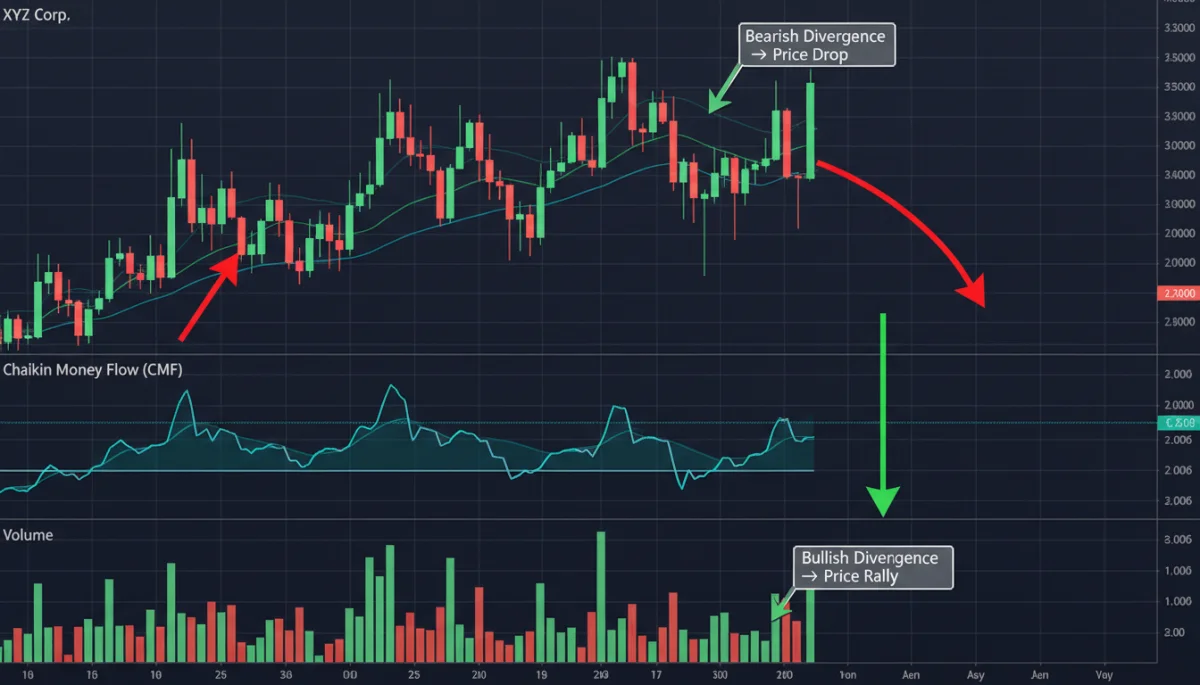
However, it’s not just about the absolute value. The trend of the CMF is equally important. A steadily rising CMF, even if still below the zero line, can signal increasing accumulation that might soon push the stock into a bullish phase. Similarly, a falling CMF, even if still positive, could indicate weakening buying interest.
Strategies for Forecasting Significant Moves
Forecasting substantial stock movements requires a systematic approach, combining CMF insights with broader market context and fundamental analysis. The CMF can act as a powerful filter to narrow down potential candidates for significant moves.
- Divergence Analysis: Look for instances where the CMF diverges from the stock price. If price makes a new high but CMF makes a lower high, it’s a bearish divergence signaling potential weakness.
- Trend Confirmation: Use CMF to confirm existing price trends. A strong uptrend with consistently positive CMF reinforces the bullish sentiment.
- Breakout Signals: Monitor CMF during consolidation phases. A strong CMF surge preceding a price breakout from a trading range can indicate a powerful move.
- Sector-Specific Analysis: Apply CMF within specific US economic sectors expected to perform well by 2026, combining technical signals with macro-economic trends.
For 2026, traders should also consider the broader economic landscape, including interest rate policies, inflation forecasts, and geopolitical stability, as these factors can significantly impact market sentiment and, by extension, CMF readings. The CMF serves as a powerful micro-level indicator, but its signals gain more weight when aligned with macro-economic tailwinds or headwinds. Identifying stocks with strong CMF signals in sectors poised for growth could be key to predicting and capitalizing on 10% price movements.
Practical Applications of CMF in Trading Strategies
The practical application of Chaikin Money Flow (CMF) extends beyond mere signal interpretation; it integrates into various trading strategies to enhance decision-making. Traders can utilize CMF to generate entry and exit points, confirm trend strength, and identify potential reversals, thereby improving the overall efficacy of their trading systems.
One of the most straightforward applications is using CMF for trend confirmation. During an established uptrend, consistently positive CMF readings reinforce the bullish sentiment, suggesting that buyers remain in control and the trend is likely to continue. Conversely, a sustained downtrend accompanied by negative CMF values confirms strong selling pressure.
Integrating CMF into Your Trading Plan
Developing a robust trading plan involves clear rules for entry, exit, and risk management. CMF can play a pivotal role in defining these rules, providing objective criteria for trade execution.
- Entry Signals: A CMF crossover above the zero line, especially when combined with a price breakout above resistance, can serve as a strong buy signal.
- Exit Signals: A CMF crossover below the zero line, particularly if accompanied by price breaking below support, can be a clear sell signal, indicating weakening buying pressure.
- Stop-Loss Placement: While CMF doesn’t directly dictate stop-loss levels, its signals can inform decisions. For instance, if CMF turns negative after a bullish entry, it might suggest tightening a stop-loss or taking partial profits.
- Portfolio Screening: Use CMF to filter stocks for potential trades. Scan for US stocks with consistently positive CMF for long opportunities or negative CMF for short-selling prospects.
Another powerful application is using CMF for divergence analysis. A bullish divergence occurs when the stock price makes a lower low, but the CMF makes a higher low. This suggests that selling pressure is diminishing, and a reversal to the upside might be imminent. Conversely, a bearish divergence, where price makes a higher high but CMF makes a lower high, indicates weakening buying pressure and a potential downside reversal.
Furthermore, CMF can be used in conjunction with multi-timeframe analysis. A strong CMF signal on a daily chart, confirmed by a similar signal on a weekly chart, provides a higher conviction trade setup. This layered approach helps traders identify stronger, more reliable trends and increases the probability of successful outcomes in the US stock market.
Limitations and Considerations for CMF in 2026
While the Chaikin Money Flow (CMF) is a valuable tool for technical analysis, it’s crucial to acknowledge its limitations and integrate them into any trading strategy, especially when looking ahead to 2026. No single indicator is foolproof, and CMF is no exception. Understanding its drawbacks helps in developing a more balanced and realistic approach to market prediction.
One primary limitation is that CMF is a lagging indicator. It uses past price and volume data to generate its signals, meaning it might confirm a trend or reversal after a significant portion of the move has already occurred. This inherent lag can sometimes lead to missed early entry points or delayed exit signals, impacting profitability.
Challenges and Nuances of CMF Application
The effectiveness of CMF can also be influenced by market conditions. In highly volatile or choppy markets, CMF signals might be less reliable, generating false positives or negatives. The indicator performs best in trending markets where accumulation or distribution patterns are more clearly defined and sustained.
- Lagging Nature: CMF uses historical data, meaning signals can appear after a price move has begun.
- False Signals: In sideways or highly volatile markets, CMF can generate misleading signals.
- Reliance on Volume: Its effectiveness is tied to accurate volume data, which can vary across different exchanges or data providers.
- Parameter Sensitivity: The look-back period (e.g., 20 or 21 days) can significantly alter signals, requiring careful optimization.
Another consideration is the subjective nature of interpretation. While the zero line crossover provides objective signals, the strength of accumulation or distribution (e.g., how positive or negative the CMF should be) can be subjective. Different traders might have varying thresholds for what constitutes a strong signal, leading to diverse trading decisions.
For 2026, macroeconomic factors and unforeseen global events could also impact the reliability of CMF. Rapid shifts in interest rates, geopolitical conflicts, or technological disruptions might cause sudden market movements that CMF, being volume-based, might not anticipate effectively. Therefore, it’s imperative to combine CMF analysis with a broader understanding of fundamental factors and global economic trends to mitigate these risks and make more informed decisions.
Optimizing CMF for Future Market Conditions (2026)
Optimizing the Chaikin Money Flow (CMF) for future market conditions, particularly as we look towards 2026, involves adapting its application to evolving financial landscapes. Market dynamics are constantly shifting, influenced by technological advancements, regulatory changes, and investor sentiment. Therefore, a static approach to CMF interpretation may not yield the best results.
One key aspect of optimization is to regularly review and potentially adjust the look-back period of the CMF. While 20 or 21 periods are common, faster-moving markets might benefit from shorter periods to capture more immediate shifts in money flow, whereas slower, more mature markets might require longer periods to smooth out noise. Experimentation with different settings is crucial to find what works best for specific assets or market segments.
Adapting CMF to Evolving Market Trends
The financial markets of 2026 might present unique challenges and opportunities. Integrating CMF with emerging data sources and analytical techniques can enhance its predictive power and relevance.
- Algorithmic Integration: Incorporate CMF signals into automated trading algorithms, allowing for rapid execution based on predefined CMF thresholds and crossovers.
- Big Data Analysis: Combine CMF data with broader market sentiment analysis derived from social media, news feeds, and other alternative data sources to gain a more holistic view.
- Intermarket Analysis: Use CMF in conjunction with analysis of related markets (e.g., bond yields, commodity prices) to identify broader capital flows that might impact US stocks.
- Machine Learning Models: Train machine learning models to identify complex patterns and correlations between CMF, price action, and other indicators that human eyes might miss.
Furthermore, consider the impact of high-frequency trading and algorithmic strategies, which are likely to be even more prevalent by 2026. These rapid trading environments can generate significant volume fluctuations that might distort traditional CMF signals. Therefore, filtering out short-term noise by focusing on longer-term CMF trends or using smoothed versions of the indicator could be beneficial.
Ultimately, optimizing CMF for 2026 and beyond means embracing a flexible and adaptive approach. It requires continuous learning, testing, and refinement of trading strategies to ensure that the indicator remains a relevant and effective tool for predicting significant US stock price movements in an increasingly complex financial world.
| Key Point | Brief Description |
|---|---|
| CMF Purpose | Measures buying/selling pressure (accumulation/distribution) using price and volume. |
| Signal Interpretation | Above zero implies accumulation, below zero implies distribution. |
| Predictive Power | Helps identify potential 10% US stock price movements by 2026. |
| Strategy Integration | Best used with other indicators and market context for confirmation. |
Frequently Asked Questions About Chaikin Money Flow
The primary purpose of the Chaikin Money Flow (CMF) indicator is to measure the amount of money flow volume over a specified period. It helps traders gauge buying and selling pressure, identifying whether a stock is under accumulation (buying) or distribution (selling) within the market.
CMF predicts movements by signaling underlying buying or selling interest. A sustained CMF above the zero line indicates strong accumulation, often preceding price rallies. Conversely, a sustained CMF below zero suggests distribution, potentially leading to price declines. Divergences between CMF and price also provide predictive clues.
While CMF is a powerful tool, it should not be used in isolation to predict 10% US stock price movements by 2026. It’s best combined with other technical indicators, price action analysis, and a thorough understanding of macroeconomic factors for more reliable forecasts and robust trading decisions.
Key limitations include its lagging nature, meaning signals can appear after a price move has started. CMF can also generate false signals in choppy or highly volatile markets. Its effectiveness relies heavily on accurate volume data and proper parameter settings, requiring careful calibration.
Optimizing CMF for future conditions involves adjusting its look-back period, integrating it with algorithmic trading, leveraging big data and machine learning, and conducting intermarket analysis. Adapting to high-frequency trading environments and focusing on longer-term trends can also enhance its predictive utility.
Conclusion
The Chaikin Money Flow (CMF) indicator offers a profound lens through which to view the intricate dance of accumulation and distribution in the US stock market. As we approach 2026, its ability to quantify buying and selling pressure provides traders with invaluable insights, potentially signaling significant 10% price movements. While not a standalone crystal ball, when strategically combined with other technical tools and a comprehensive understanding of market dynamics, CMF significantly enhances the robustness of any trading strategy. Its continued relevance lies in its adaptive application and the informed interpretation of its signals within an ever-evolving financial landscape.
