MFI: Spotting Institutional Accumulation in 2026 US Equities
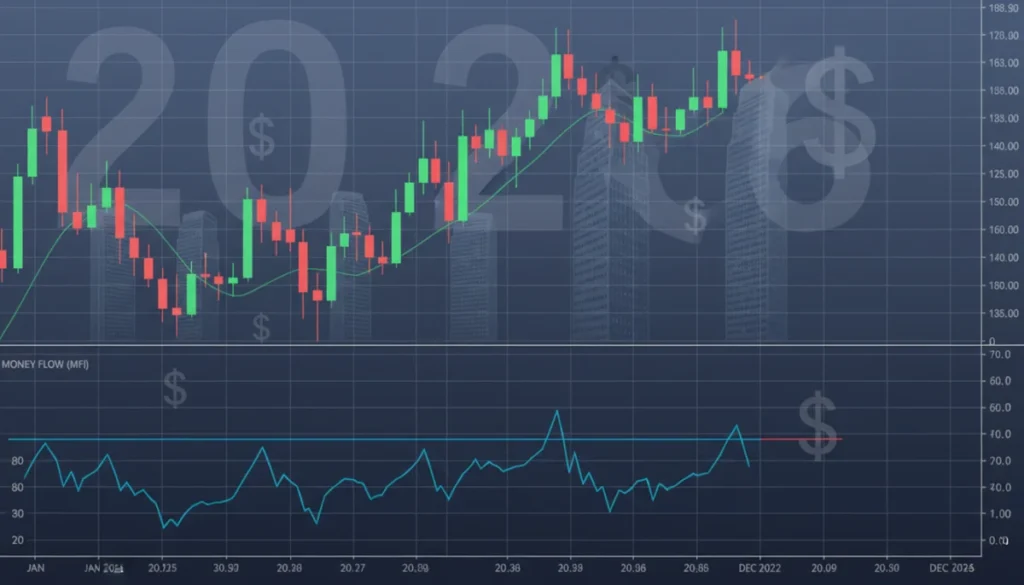
The Money Flow Index (MFI) is a crucial technical indicator for discerning institutional accumulation in 2026 US equities, offering insights into potential price movements based on money flow volume.
Are you looking for an edge in the volatile 2026 US equities market? Understanding how to use the Money Flow Index (MFI): Spotting Institutional Accumulation in 2026 US Equities can be a game-changer, providing critical insights into where the smart money is moving.
Understanding the Money Flow Index (MFI)
The Money Flow Index (MFI) is a momentum indicator that measures the strength of money flowing into and out of a security. It is an oscillator that uses both price and volume data, providing a more comprehensive picture than indicators that rely solely on price. Often referred to as a volume-weighted Relative Strength Index (RSI), the MFI helps traders and investors identify overbought or oversold conditions, as well as potential divergences that could signal a trend reversal.
Unlike other momentum oscillators that only consider price, the MFI incorporates volume, which is a crucial element in confirming the conviction behind price movements. High volume during a price increase suggests strong buying pressure, while high volume during a price decrease indicates strong selling pressure. By integrating volume, the MFI offers a unique perspective on the true sentiment of the market, making it particularly useful for identifying significant shifts in institutional interest.
How MFI is Calculated
The calculation of MFI involves several steps, starting with the determination of the Typical Price (TP) for each period. The TP is the average of the high, low, and close prices. This initial step sets the foundation for understanding the price movement within a given timeframe.
- Typical Price (TP): (High + Low + Close) / 3
- Money Flow (MF): Typical Price x Volume
- Positive Money Flow: Sum of Money Flow when the current TP is greater than the previous TP.
- Negative Money Flow: Sum of Money Flow when the current TP is less than the previous TP.
- Money Ratio (MR): Positive Money Flow / Negative Money Flow
- Money Flow Index (MFI): 100 – (100 / (1 + Money Ratio))
These calculations typically use a 14-period lookback, which is a common setting, though it can be adjusted based on trading strategy and market volatility. The resulting MFI value oscillates between 0 and 100, providing a normalized view of money flow strength. Understanding these components is essential for accurately interpreting MFI signals and effectively utilizing the indicator in your trading decisions.
In essence, the MFI provides a nuanced view of market dynamics by blending price and volume. This dual consideration makes it a powerful tool for uncovering underlying strength or weakness that purely price-based indicators might miss. It’s a foundational understanding for anyone looking to decipher institutional moves.
Identifying Institutional Accumulation with MFI
Institutional accumulation refers to the strategic buying of a security by large financial institutions, such as hedge funds, mutual funds, and pension funds. These entities often have significant capital, and their buying activity can precede substantial price increases. The Money Flow Index (MFI) is an excellent tool for detecting this accumulation, as institutional buying typically involves large volumes of shares, which directly impacts the MFI calculation.
When institutions are accumulating shares, you will often see the MFI rising, even if the price itself is not yet making significant upward moves. This divergence between price and MFI can be a powerful early warning signal. It suggests that while the overall market might not be fully aware, smart money is quietly entering the asset, laying the groundwork for a future rally.
Key MFI Signals for Accumulation
Several specific MFI signals can indicate institutional accumulation. Recognizing these patterns can give individual investors a significant advantage in the market. It’s not just about the MFI line moving up; it’s about how it moves in relation to price.
- Rising MFI with Stable or Slightly Declining Price: This is a classic sign of accumulation. Institutions are buying heavily, pushing up the money flow, but their buying might be spread out or absorbed by retail selling, keeping the price relatively flat.
- MFI Divergence: When the price makes lower lows, but the MFI makes higher lows, it indicates bullish divergence. This suggests that selling pressure is weakening, and money is starting to flow back into the asset, often driven by institutional interest.
- MFI Moving Out of Oversold Territory (Below 20): A move from below 20 (oversold) back above it, especially with increasing volume, can signal that institutions are stepping in to buy at what they perceive as attractive prices.
Observing these signals requires careful attention to both the MFI line and the corresponding price action. It’s not enough to look at one in isolation. The interplay between them provides the context needed for informed decision-making. The goal is to catch these subtle shifts before they become obvious to the broader market.
In essence, the MFI acts as a sophisticated radar for institutional footprints. By diligently tracking its movements and cross-referencing with price, investors can gain a clearer understanding of where significant capital is being deployed. This strategic insight is invaluable for proactive portfolio management.
MFI in the Context of 2026 US Equities Market
The 2026 US equities market is expected to be dynamic, influenced by evolving macroeconomic factors, technological advancements, and geopolitical shifts. In such an environment, traditional price-based indicators may sometimes lag, making the Money Flow Index (MFI) an even more critical tool for discerning underlying market sentiment and institutional moves. The increased volatility and rapid shifts common in modern markets demand indicators that can provide a deeper, volume-backed perspective.
As market participants become more sophisticated and algorithmic trading gains further prominence, identifying genuine institutional accumulation requires tools that can cut through the noise. MFI, with its volume component, helps filter out minor price fluctuations and focuses on where substantial capital is truly being deployed. This is particularly relevant in a market where retail investors often react to news, while institutions strategically position themselves well in advance.
Why MFI is Relevant for 2026
- Increased Market Volatility: With global economic uncertainties and technological disruptions, 2026 could see heightened market volatility. MFI helps identify genuine buying/selling pressure amidst erratic price swings.
- Algorithmic Trading Dominance: Institutional algorithms often execute large orders incrementally, which can be hard to spot with just price charts. MFI’s volume integration can reveal these sustained accumulation efforts.
- Focus on Fundamental Shifts: Institutions often position themselves based on long-term fundamental shifts. MFI can signal their early entry into sectors or companies poised for growth, even before these trends become widely recognized.
Considering the rapid pace of market evolution, relying solely on lagging indicators can be detrimental. The MFI offers a forward-looking perspective by highlighting the conviction behind price movements. Its ability to signal institutional activity before major price rallies makes it an indispensable tool for investors aiming to capitalize on emerging opportunities in 2026.
Ultimately, the MFI provides a robust framework for navigating the complexities of the 2026 US equities market. By leveraging its insights, investors can better anticipate significant price movements and align their strategies with the actions of major market players, enhancing their potential for success.
Combining MFI with Other Technical Indicators
While the Money Flow Index (MFI) is a powerful standalone indicator, its effectiveness is significantly enhanced when combined with other technical analysis tools. No single indicator provides a complete picture, and a confluence of signals from multiple indicators offers greater confirmation and reduces the likelihood of false positives. This multi-indicator approach is a cornerstone of sophisticated technical analysis, allowing for more robust trading decisions.
For instance, using MFI in conjunction with trend-following indicators can help confirm the direction of institutional accumulation within an established trend. Similarly, combining it with volatility indicators can provide insights into the strength and sustainability of potential price moves. The goal is to build a comprehensive view that triangulates various data points to create a high-conviction trade setup.
Effective Indicator Combinations
Several combinations prove particularly useful for confirming MFI signals and refining entry and exit points. These pairings leverage the strengths of each indicator to provide a more holistic market perspective.
- MFI and RSI: While both are momentum oscillators, RSI focuses solely on price momentum. A divergence in MFI (indicating institutional accumulation) confirmed by a corresponding bullish divergence in RSI can provide a stronger signal for an upcoming price rally.
- MFI and Moving Averages: When the MFI shows accumulation (rising MFI, stable price), and the price subsequently breaks above a key moving average (e.g., 50-day or 200-day EMA), it can be a strong buy signal, indicating that institutional buying is now driving price upwards.
- MFI and Support/Resistance Levels: If MFI indicates accumulation near a significant support level, it suggests institutions are stepping in to defend that level, potentially leading to a bounce. Conversely, MFI divergence at resistance could signal institutional selling.
- MFI and Volume Profile: Volume Profile can show where the most trading volume has occurred at different price levels. If MFI indicates accumulation, and Volume Profile shows increasing volume at higher prices, it confirms strong institutional interest.
The synergy created by combining MFI with these indicators allows for a more nuanced interpretation of market dynamics. It helps to differentiate between speculative retail activity and genuine institutional positioning. This approach reduces noise and focuses on high-probability setups, leading to more confident trading decisions.
By integrating MFI into a broader framework of technical analysis, investors can develop a more robust and reliable strategy. This layered approach not only enhances signal confirmation but also provides a deeper understanding of market structure and participant behavior, critical for success in complex markets.
Practical Strategies for Utilizing MFI in 2026
Implementing the Money Flow Index (MFI) effectively requires a strategic approach that goes beyond simply observing the indicator. For 2026 US equities, a practical strategy involves not only identifying accumulation but also managing risk and understanding market context. The goal is to translate MFI signals into actionable trading decisions, maximizing potential gains while minimizing exposure to adverse movements.
One key aspect of practical MFI utilization is recognizing that the indicator is not a crystal ball. It provides probabilities, not certainties. Therefore, combining MFI signals with sound risk management principles, such as setting stop-loss orders and managing position sizes, is paramount. Emotional discipline is also crucial; acting on clear signals rather than impulse is vital for long-term success.
Implementing MFI in Trading Decisions
- Scan for Bullish Divergences: Regularly screen US equities for situations where price makes lower lows but MFI makes higher lows. This is a strong preliminary sign of institutional accumulation.
- Confirm with Volume: Once a potential MFI accumulation signal is identified, confirm it with above-average trading volume during the MFI’s upward movement. This validates the institutional presence.
- Identify Overbought/Oversold Zones: Use MFI’s overbought (above 80) and oversold (below 20) levels. A sustained move out of oversold territory, especially with divergence, is a powerful buy signal.
- Set Entry and Exit Points: Use MFI alongside support/resistance levels or moving averages to determine optimal entry points. For exits, look for MFI divergences signaling distribution (MFI making lower highs while price makes higher highs) or MFI moving into overbought territory.
- Utilize Multiple Timeframes: Confirm MFI signals on a daily chart with MFI trends on weekly charts for higher conviction. Institutional accumulation often plays out over longer periods.
Another crucial strategy involves backtesting your MFI-based approaches against historical data. This helps you understand how the indicator performs in various market conditions and allows you to fine-tune your parameters. Adaptability is key; the market in 2026 might present unique challenges, and a flexible strategy will be more resilient.
Ultimately, a practical approach to MFI involves combining its analytical power with disciplined execution and continuous learning. By doing so, investors can leverage MFI to uncover institutional accumulation and make more informed decisions in the evolving 2026 US equities landscape.

Challenges and Limitations of MFI
While the Money Flow Index (MFI) is a valuable tool for spotting institutional accumulation, it is not without its challenges and limitations. Understanding these caveats is crucial for responsible and effective application of the indicator. Over-reliance on any single indicator can lead to suboptimal decisions, and MFI is no exception. Acknowledging its boundaries allows for a more balanced and nuanced analytical approach.
One primary limitation is the potential for false signals, especially in highly volatile or choppy markets. The MFI, like other momentum oscillators, can sometimes generate signals that do not lead to the anticipated price movement. This is why confirmation from other indicators and a broader market context are always recommended. Traders must exercise discretion and not blindly follow every MFI signal.
Common Limitations and How to Mitigate Them
Addressing the inherent limitations of MFI involves proactive strategies and a comprehensive understanding of market behavior. These mitigation techniques help in refining the signals and improving decision-making accuracy.
- Lagging Nature: MFI is a lagging indicator to some extent, as it uses past price and volume data. While it can signal accumulation, the optimal entry point might have already passed by the time the signal is clear. Mitigation involves combining it with leading indicators or using it on higher timeframes.
- False Divergences: Sometimes, MFI might show divergence that doesn’t result in a significant price reversal. This can occur in strong trending markets where MFI might become overbought/oversold and stay there. Confirming divergences with price action and other indicators is vital.
- Parameter Sensitivity: The default 14-period setting for MFI might not be optimal for all securities or market conditions. Adjusting the lookback period can alter sensitivity, but finding the right balance requires extensive testing and experience.
- Volume Interpretation: The MFI relies on volume, but not all volume is equal. Programmatic or low-conviction volume might inflate MFI without significant institutional interest. This is mitigated by looking for sustained, high-volume movements.
Another challenge lies in the subjective interpretation of MFI signals. What one trader considers a strong divergence, another might view as ambiguous. Developing a consistent methodology and sticking to it is crucial for minimizing subjective bias. Regular review of trades based on MFI signals can help refine this methodology over time.
In conclusion, while MFI is a powerful instrument for uncovering institutional activity, it functions best as part of a diversified analytical toolkit. By understanding and actively mitigating its limitations, traders can harness its strengths more effectively, making more informed decisions in the complex 2026 US equities market.
The Future of MFI in Technical Analysis (2026 and Beyond)
As financial markets continue to evolve with increasing speed and complexity, the role of technical indicators like the Money Flow Index (MFI) is also transforming. In 2026 and beyond, MFI is likely to remain a relevant and valuable tool, but its application will undoubtedly adapt to new technological advancements and market structures. The integration of AI and machine learning in trading systems will redefine how indicators are used, moving towards more automated and nuanced interpretations.
The ability of MFI to incorporate volume data, a fundamental aspect of market activity, ensures its enduring relevance. While new, sophisticated algorithms might emerge, the core principle of money flow remains critical for understanding market conviction. Future developments might see MFI being integrated into more complex predictive models, enhancing its forecasting capabilities beyond simple divergence signals.
Evolving Applications of MFI
The future application of MFI will likely involve more sophisticated integration with advanced analytical techniques. This evolution aims to extract even deeper insights from the indicator and reduce the human element of interpretation.
- AI-Enhanced Signal Generation: AI could analyze vast datasets, including MFI, to identify subtle patterns of institutional accumulation that human eyes might miss, generating high-probability trade signals automatically.
- Cross-Asset Analysis: MFI could be used more extensively in cross-asset analysis, comparing money flow in equities to bonds, commodities, or cryptocurrencies, to identify broader systemic flows and risk appetite.
- Adaptive MFI Parameters: Machine learning algorithms could dynamically adjust MFI’s lookback period and overbought/oversold thresholds based on real-time market volatility and asset characteristics, optimizing its performance.
- Predictive Modeling: MFI data, combined with other indicators and alternative data sources, could feed into advanced predictive models to forecast institutional positioning and market shifts with greater accuracy.
Furthermore, the democratization of advanced trading tools will make indicators like MFI accessible to a wider range of investors, albeit often through simplified interfaces. Educational resources will continue to emphasize the importance of understanding the underlying mechanics of such indicators, rather than just relying on their signals.
In summary, the Money Flow Index is poised to maintain its significance in technical analysis for 2026 and beyond. Its fundamental strength in combining price and volume ensures its foundational value, while technological advancements will likely unlock new, more sophisticated ways to utilize its insights for spotting institutional accumulation and navigating complex markets.
| Key Point | Brief Description |
|---|---|
| What MFI Is | A volume-weighted momentum oscillator measuring money flow into/out of an asset. |
| Spotting Accumulation | Rising MFI with stable/declining price often signals institutional buying. |
| MFI Divergence | Price lower lows, MFI higher lows = bullish sign of weakening selling. |
| Combining Indicators | Pair MFI with RSI, moving averages, or support/resistance for stronger signals. |
Frequently Asked Questions About MFI and Institutional Accumulation
The MFI’s primary advantage is its inclusion of volume data, which provides a more robust indication of money flow strength. Unlike indicators solely focused on price, MFI reveals the conviction behind price movements, making it superior for identifying genuine institutional interest.
MFI helps by showing rising money flow even if prices are stable or slightly declining. This divergence suggests large players are quietly buying, absorbing selling pressure. A bullish divergence (price lower lows, MFI higher lows) is a strong accumulation signal.
Traditionally, MFI values above 80 indicate overbought conditions, suggesting a potential reversal downwards. Conversely, values below 20 signal oversold conditions, hinting at a possible upward reversal. These levels can be adjusted based on market volatility.
While MFI is powerful, relying solely on it is not recommended. It’s best used in conjunction with other technical indicators like RSI, moving averages, or support/resistance levels. This multi-indicator approach provides stronger confirmation and reduces false signals.
AI and machine learning could significantly enhance MFI’s utility by dynamically adjusting its parameters, identifying complex patterns of institutional activity, and integrating it into advanced predictive models for more accurate forecasts of market movements and accumulation trends.
Conclusion
In the dynamic landscape of 2026 US equities, the Money Flow Index (MFI) stands out as an indispensable tool for investors seeking to identify institutional accumulation. Its unique ability to combine price and volume data offers a profound insight into the underlying conviction of market movements, allowing for the early detection of smart money positioning. While MFI, like any indicator, has its limitations, integrating it with other technical analysis tools and employing sound risk management strategies significantly enhances its predictive power. As markets evolve, the fundamental principles behind MFI will ensure its continued relevance, providing a critical edge for those who master its application in an increasingly complex financial world.
