Parabolic SAR: Trailing Stops for 18% Profit in Volatile 2026 US Markets

Parabolic SAR (Stop and Reverse) is a crucial technical indicator that helps traders identify potential trend reversals and set effective trailing stop-loss orders, aiming to protect significant profits, potentially up to 18%, amidst the anticipated volatility of the 2026 US financial markets.
In the ever-evolving landscape of financial markets, especially with the anticipated volatility of the 2026 US markets, safeguarding your gains is paramount. The Parabolic SAR: Trailing Stops for 18% Profit Protection in Volatile 2026 US Markets offers a robust strategy for traders looking to not only identify trend directions but also to lock in substantial profits. This article delves into how this powerful technical analysis tool can become an indispensable part of your trading arsenal, helping you navigate market fluctuations with greater confidence and secure your hard-earned returns.
Understanding the Parabolic SAR Indicator
The Parabolic Stop and Reverse (SAR) is a time and price-based technical analysis tool developed by J. Welles Wilder Jr. It is designed to identify the direction of an asset’s momentum and the potential reversal points, making it a favorite among trend-following traders. Often depicted as a series of dots placed either above or below the price bars, the SAR indicator offers a clear visual representation of a trend’s trajectory and strength.
When the dots are below the price, it signals an uptrend, suggesting that the price is likely to continue rising. Conversely, when the dots appear above the price, it indicates a downtrend, implying further price declines. The beauty of the Parabolic SAR lies in its ability to adjust dynamically with the market, providing a continuous trailing stop that moves closer to the price as the trend progresses, thereby locking in profits more effectively.
How Parabolic SAR Works
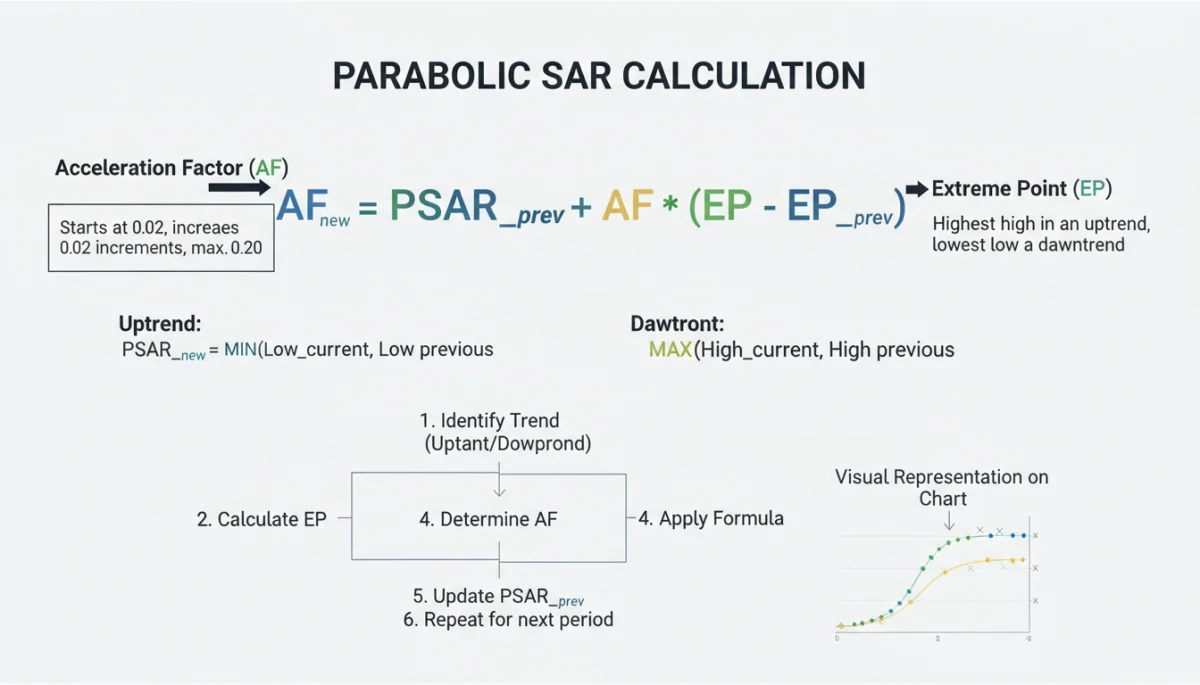
The core mechanism of the Parabolic SAR involves a calculation that considers the Extreme Point (EP) and the Acceleration Factor (AF). The EP is the highest high in an uptrend or the lowest low in a downtrend, acting as a reference for the SAR calculation. The AF starts at a small value, typically 0.02, and increases incrementally with each new EP, up to a maximum of 0.20. This increasing acceleration factor causes the SAR dots to move faster and closer to the price as the trend matures.
- Uptrend Calculation: SAR moves upwards, trailing the price.
- Downtrend Calculation: SAR moves downwards, trailing the price.
- Reversal Signal: A shift in the SAR dots from below to above (or vice versa) indicates a potential trend reversal.
The dynamic nature of the SAR makes it particularly useful for protecting profits. As an uptrend continues, the SAR dots rise, effectively raising the stop-loss level. Should the price reverse and close below the SAR, it signals an exit point, allowing traders to secure a significant portion of their accumulated gains. This continuous adjustment is what makes it a powerful tool for navigating volatile markets.
In conclusion, the Parabolic SAR is more than just a trend indicator; it’s a built-in profit protection mechanism. By understanding its foundational principles and how its unique calculation adapts to market movements, traders can leverage it to make more informed decisions and safeguard their capital, especially in unpredictable market conditions.
Implementing Trailing Stops with Parabolic SAR
Implementing trailing stops using the Parabolic SAR indicator is a strategic move that can significantly enhance a trader’s risk management and profit-taking capabilities. Unlike fixed stop-loss orders, which remain static, a trailing stop automatically adjusts as the price moves in a favorable direction, ensuring that profits are protected without prematurely exiting a profitable trade. The Parabolic SAR provides an intuitive and visual way to manage these dynamic stops.
When you initiate a long position, the Parabolic SAR dots will appear below the price. As the price moves higher, the SAR dots will follow, creating a rising floor for your stop-loss. This means that if the market turns against your position, your stop-loss will have already moved up, locking in a portion of your gains. For short positions, the inverse applies, with the SAR dots above the price, moving lower as the price falls.
Strategic Entry and Exit Points
The primary benefit of using Parabolic SAR for trailing stops is its clear signaling of potential trend reversals. When the SAR dots flip from below the price to above it during an uptrend, it acts as a strong signal to exit a long position. This reversal indicates that the upward momentum may be waning, and a downtrend could be commencing. Similarly, a flip from above to below in a downtrend suggests covering a short position.
- Entry Signal: Enter a long position when SAR dots move below the price after a downtrend.
- Exit Signal: Exit a long position when SAR dots move above the price during an uptrend.
- Short Entry: Enter a short position when SAR dots move above the price after an uptrend.
- Short Cover: Cover a short position when SAR dots move below the price during a downtrend.
This systematic approach removes much of the emotional decision-making from trading. By setting your stop-loss at the current SAR level, you are essentially allowing the market to dictate when to exit, based on its own momentum and volatility. This helps to prevent premature exits due to minor retracements while ensuring that substantial profits are not given back to the market.
In essence, integrating Parabolic SAR into your trailing stop strategy provides a disciplined framework for managing trades. It allows traders to ride out strong trends for maximum profit potential while simultaneously safeguarding against sudden reversals, making it an invaluable tool for maintaining an edge in competitive markets.
Maximizing Profit Protection: The 18% Target
The concept of protecting up to 18% of profits in volatile markets, particularly when employing the Parabolic SAR, is not an arbitrary figure but rather a realistic aspiration achievable through disciplined application and strategic understanding of the indicator’s mechanics. In dynamic environments like the 2026 US markets, where rapid shifts can erode gains quickly, a robust profit protection strategy is critical. The 18% target represents a significant portion of potential gains that can be secured using the intelligent trailing stop functionality of the Parabolic SAR.
This level of protection is often realized when a strong trend has developed, allowing the Parabolic SAR to move sufficiently close to the price action. As the trend progresses, the acceleration factor in the SAR calculation ensures that the stop-loss level moves at an increasing rate, effectively locking in more profit with each price increment. This prevents large drawdowns from a peak profit position, ensuring that a substantial portion of the unrealized gains becomes realized.
Factors Influencing Profit Protection
Several factors contribute to the effectiveness of the Parabolic SAR in achieving such profit protection. The initial setting of the acceleration factor and its increment plays a crucial role. A smaller initial AF and increment will result in a slower-moving SAR, allowing more room for price fluctuations but potentially exposing more profit to risk. Conversely, a larger AF will make the SAR more sensitive, trailing closer to the price and securing profits more aggressively.
- Acceleration Factor (AF): Adjusting the AF can fine-tune the sensitivity of the trailing stop.
- Market Volatility: Higher volatility may require slightly adjusted AF settings to avoid premature stops.
- Trend Strength: Stronger, more sustained trends allow the SAR to protect a greater percentage of profits.
- Timeframe: The chosen trading timeframe impacts the SAR’s responsiveness and profit protection.
Achieving the 18% profit protection target with Parabolic SAR also relies on the trader’s ability to identify and enter trades during the early stages of a strong trend. The longer and stronger the trend, the more effectively the SAR can trail the price and secure a larger percentage of the gains. It’s about letting winners run while simultaneously mitigating the risk of giving back too much profit during a reversal.
Ultimately, the 18% profit protection is a testament to the Parabolic SAR’s ability to adapt and protect. By judiciously applying this indicator and understanding its nuances, traders can significantly enhance their ability to retain profits, turning theoretical gains into tangible returns, particularly in the unpredictable trading landscape of 2026.
Parabolic SAR in Volatile 2026 US Markets
The year 2026 is anticipated to bring its share of volatility to the US financial markets, driven by various macroeconomic factors, geopolitical shifts, and technological advancements. In such an environment, traditional trading strategies that rely on static stop-loss levels can be severely tested, leading to missed opportunities or excessive losses. This is where the dynamic capabilities of the Parabolic SAR truly shine, offering a sophisticated mechanism to navigate uncertainty and protect capital.
Volatility often leads to sharp, unpredictable price swings, making it challenging for traders to hold onto profitable positions. The Parabolic SAR, with its inherent ability to adjust the stop-loss level in real-time, provides a flexible defense against these sudden shifts. As prices move favorably, the SAR moves closer, ensuring that even if a sudden reversal occurs, a substantial portion of the profit is preserved. This dynamic adjustment is crucial for surviving and thriving in a volatile market.
Adapting SAR Settings for Volatility
To optimize the Parabolic SAR for volatile conditions, traders might consider adjusting its default settings. While the standard acceleration factor (AF) of 0.02 with an increment of 0.02 up to a maximum of 0.20 works well in many scenarios, increased market volatility could warrant slight modifications. A slightly higher initial AF or increment might make the SAR more responsive, trailing the price more closely and thus offering tighter profit protection.
- Increased Initial AF: A slightly higher starting AF (e.g., 0.03) for quicker stop adjustments.
- Higher Increment: Boosting the increment (e.g., 0.03) to accelerate the SAR’s movement towards price.
- Maximum AF Adjustment: Potentially increasing the maximum AF (e.g., 0.22) in extremely volatile phases.
- Timeframe Selection: Using shorter timeframes for quicker responses to intraday volatility.
However, it is essential to strike a balance; an overly sensitive SAR can lead to premature exits, known as “whipsaws,” where the price briefly touches the stop and then resumes its original trend. Therefore, careful backtesting and observation of market behavior are necessary to find the optimal settings for specific assets and market conditions in 2026. The goal is to maximize profit protection without stifling the trade’s potential.
In summary, the Parabolic SAR is an invaluable ally for traders facing the volatile 2026 US markets. Its adaptive nature and real-time stop-loss adjustment capabilities offer a superior method for preserving capital and locking in profits, making it a cornerstone of a resilient trading strategy.
Combining Parabolic SAR with Other Indicators
While the Parabolic SAR is a powerful standalone indicator, its efficacy can be significantly enhanced when combined with other technical analysis tools. This synergistic approach helps to filter out false signals, confirm trends, and provide a more comprehensive view of market dynamics. In the volatile 2026 US markets, corroborating signals from multiple indicators can be crucial for making high-conviction trading decisions and further bolstering profit protection strategies.
One popular combination involves using the Parabolic SAR with moving averages (MAs). A long-term moving average, such as the 50-period or 200-period MA, can help confirm the overarching trend direction. For instance, if the price is above the 200-period MA, indicating a long-term uptrend, and the Parabolic SAR also signals an uptrend, the confidence in a long position increases. The SAR can then be used for precise entry and exit points, as well as for trailing stops, within the confirmed larger trend.
Popular Indicator Combinations
Another effective pairing is with oscillators like the Relative Strength Index (RSI) or Stochastic Oscillator. These indicators are excellent for identifying overbought or oversold conditions, which often precede trend reversals. If the Parabolic SAR is signaling a potential trend reversal, and the RSI indicates an overbought market (for an uptrend) or an oversold market (for a downtrend), the confluence of these signals provides a stronger indication of an imminent price shift.
- SAR + Moving Averages: Confirm overall trend direction and filter out weaker SAR signals.
- SAR + RSI/Stochastic: Identify overbought/oversold conditions to confirm SAR reversal signals.
- SAR + MACD: Use MACD for momentum confirmation, entering trades when both indicators align.
- SAR + Volume: Higher volume on SAR reversal signals adds conviction to the trade.
The Moving Average Convergence Divergence (MACD) is another excellent companion. MACD provides insights into momentum and trend strength. When the MACD line crosses above its signal line, indicating bullish momentum, and the Parabolic SAR simultaneously flips below the price, it strengthens the case for a long entry. Conversely, a bearish MACD cross combined with an upward flip of the SAR dots reinforces a short entry signal.
By integrating the Parabolic SAR with other complementary indicators, traders can build a more robust and reliable trading system. This multi-indicator approach helps to reduce noise, increase the accuracy of signals, and ultimately lead to better-informed decisions, which is paramount for achieving consistent profit protection in volatile markets.
Common Pitfalls and How to Avoid Them
While the Parabolic SAR is a highly effective tool for trend following and profit protection, it is not without its limitations. Understanding these common pitfalls and knowing how to circumvent them is crucial for maximizing its utility, especially when aiming for significant profit protection in the volatile 2026 US markets. Blindly following any single indicator can lead to suboptimal results, and the SAR is no exception.
One of the most frequent issues traders encounter with the Parabolic SAR is its tendency to generate numerous false signals, or “whipsaws,” in sideways or range-bound markets. In the absence of a clear trend, the SAR dots will flip frequently, leading to multiple small losses if each signal is acted upon. This behavior is inherent to its design as a trend-following indicator; it thrives when there’s a discernible direction.
Strategies for Mitigation
To avoid whipsaws, it is imperative to use the Parabolic SAR in conjunction with other trend-confirming indicators. As discussed, moving averages can be instrumental here. If the price is consistently oscillating around a key moving average, indicating a lack of clear trend, it’s often best to either avoid trading with the SAR or use it with extreme caution. Waiting for a clear breakout and sustained movement above or below the moving average before trusting SAR signals can save a lot of grief.
- Avoid Sideways Markets: Use other indicators (e.g., ADX) to confirm trend presence before applying SAR.
- Confirm with Volume: Look for increased volume on SAR reversal signals to validate their strength.
- Adjust AF Settings: Slightly lower the acceleration factor to reduce sensitivity in choppier markets.
- Higher Timeframes: Trade on longer timeframes to filter out short-term noise and false signals.
Another pitfall is relying solely on the SAR for entry and exit decisions without considering broader market context, fundamental analysis, or risk management principles. While the SAR provides excellent stop-loss guidance, it doesn’t tell the whole story. A sudden news event or an unexpected economic report can override any technical signal, no matter how strong. Therefore, a holistic approach that incorporates fundamental analysis and a solid risk management plan is always recommended.
In conclusion, mastering the Parabolic SAR involves not just understanding its strengths but also recognizing its weaknesses. By being aware of its limitations, particularly in non-trending markets, and by employing complementary indicators and a comprehensive trading strategy, traders can effectively mitigate risks and harness the full power of the Parabolic SAR for robust profit protection.
Case Studies and Real-World Application
To truly appreciate the power of Parabolic SAR: Trailing Stops for 18% Profit Protection in Volatile 2026 US Markets, it’s essential to examine its application through real-world scenarios and case studies. These examples illustrate how traders can leverage the indicator’s dynamic capabilities to navigate market volatility, secure gains, and minimize potential losses. While 2026 specific data is speculative, past market behavior offers valuable insights into its prospective utility.
Consider a hypothetical scenario in the tech sector, a segment often characterized by rapid growth and sudden corrections. A trader identifies an emerging uptrend in a prominent tech stock, confirmed by other indicators such as a rising 50-day moving average. Upon initiating a long position, the Parabolic SAR dots appear below the price. As the stock price rallies, the SAR dots diligently follow, creating a continuously adjusting stop-loss. This allows the trader to ride the uptrend, capturing significant gains.
Illustrative Scenarios
In this scenario, as the stock approaches a new all-time high, the market experiences a sudden, sharp pullback due to unforeseen regulatory news. Without the dynamic trailing stop provided by the Parabolic SAR, a fixed stop-loss might have been too far below, leading to a larger profit erosion. However, because the SAR had moved steadily upward, it triggers an exit at a much higher price point, effectively locking in a substantial portion of the accumulated profit—potentially the targeted 18% or more—before the full extent of the correction hits.
- Scenario 1 (Uptrend): SAR effectively trails price, locking in gains during a sudden market correction.
- Scenario 2 (Downtrend): SAR guides short-selling profits, adjusting stop-loss as price falls.
- Scenario 3 (Range-bound): SAR generates false signals, highlighting the need for confirmation indicators.
- Scenario 4 (High Volatility): Adjusted SAR settings prevent premature exits while still protecting profit.
Another example could involve a short position in a commodity market experiencing a downturn. As the commodity price declines, the Parabolic SAR dots remain above the price, moving downwards. This continuously lowers the stop-loss level, allowing the trader to profit from the extended downtrend. When the market eventually shows signs of reversal, and the SAR flips below the price, the short position is covered, securing the profits generated during the decline.
These case studies underscore the practical benefits of the Parabolic SAR. Its ability to adapt to market conditions, whether trending up or down, and its inherent profit-protection mechanism make it an invaluable tool for traders seeking to optimize their returns and manage risk effectively in the dynamic trading environment of 2026.
Advanced Strategies and Customization
Beyond its standard application, the Parabolic SAR offers avenues for advanced strategies and customization, allowing seasoned traders to fine-tune its performance for specific market conditions and personal trading styles. In the context of the highly dynamic 2026 US markets, understanding these advanced techniques can provide a significant edge in achieving and surpassing the 18% profit protection target. Customizing the Parabolic SAR means adapting it to your unique trading philosophy and the nuances of the assets you trade.
One common customization involves adjusting the acceleration factor (AF) and its increment. While the default settings (AF 0.02, increment 0.02, max AF 0.20) are suitable for general use, altering these values can change the sensitivity of the indicator. For instance, a lower initial AF might be preferred by traders who want to give their trades more room to breathe, especially in less volatile assets. Conversely, a higher initial AF and increment could be used for highly volatile instruments or shorter timeframes to ensure tighter stops and more aggressive profit protection.
Optimizing SAR Parameters
Another advanced strategy involves using multiple Parabolic SAR indicators with different settings on the same chart. A shorter-term SAR could be used for immediate profit protection and entry/exit signals, while a longer-term SAR could provide confirmation of the overall trend. This layered approach offers a more nuanced view of market momentum and potential reversal points, helping to filter out noise and improve signal reliability.
- Multi-SAR Approach: Employing two SARs with different AFs for confirming trend and tighter stops.
- Timeframe Alignment: Using SAR on higher timeframes for trend confirmation, and lower timeframes for execution.
- Volatility-Based Adjustments: Dynamically changing AF based on current market volatility (e.g., using ATR).
- SAR with Price Action: Combining SAR signals with candlestick patterns or support/resistance levels for stronger confirmation.
Furthermore, integrating the Parabolic SAR with price action analysis can unlock deeper insights. Instead of solely relying on the SAR dots, traders can look for candlestick patterns that confirm the SAR’s signals. For example, a bearish engulfing pattern appearing as the SAR flips above the price provides a much stronger sell signal than the SAR alone. Similarly, a bullish hammer coinciding with the SAR flipping below the price can be a powerful buy signal.
In essence, advanced strategies and customization of the Parabolic SAR transform it from a basic trend-following tool into a sophisticated component of a comprehensive trading system. By experimenting with its parameters and combining it intelligently with other analytical techniques, traders can significantly enhance their ability to protect profits and navigate the complexities of the 2026 US markets.
| Key Aspect | Brief Description |
|---|---|
| Parabolic SAR Function | Identifies trend direction and potential reversal points, acting as a dynamic trailing stop. |
| Profit Protection | Aims to secure up to 18% of profits by continuously adjusting stop-loss levels. |
| Volatile Markets | Highly effective in 2026 US markets due to its adaptive trailing stop mechanism. |
| Strategic Use | Best combined with other indicators to confirm trends and avoid false signals. |
Frequently Asked Questions About Parabolic SAR
The Parabolic SAR (Stop and Reverse) is primarily used to identify the direction of a market trend and to provide dynamic trailing stop-loss levels, helping traders protect accumulated profits and signal potential trend reversals. It visually trails price action with dots.
In volatile markets, the Parabolic SAR continuously adjusts the stop-loss level closer to the current price as a trend progresses. This dynamic movement ensures that a significant portion of unrealized gains is locked in, minimizing potential losses if a sudden market reversal occurs.
While Parabolic SAR can be used independently, it performs best when combined with other technical indicators. This helps to confirm trend strength, filter out false signals in sideways markets, and provide a more robust trading strategy, especially in complex market conditions.
The 18% profit protection target is an illustrative goal representing a substantial portion of potential gains that can be secured using the Parabolic SAR’s trailing stop mechanism. It highlights the indicator’s effectiveness in preserving profits during strong trends, even amidst market volatility.
Yes, a common drawback is its tendency to generate false signals or ‘whipsaws’ in sideways or choppy markets where there is no clear trend. This can lead to frequent, small losses if not combined with other trend-confirming indicators or used in appropriate market conditions.
Conclusion
The Parabolic SAR: Trailing Stops for 18% Profit Protection in Volatile 2026 US Markets stands out as an indispensable tool for traders navigating the complexities of modern financial landscapes. Its unique ability to provide dynamic trailing stop-loss levels offers a robust mechanism for safeguarding profits and managing risk effectively. By understanding its mechanics, strategically implementing its signals, and combining it judiciously with other indicators, traders can significantly enhance their ability to secure substantial gains, even in the face of anticipated market volatility. The journey to consistent profitability in 2026 will undoubtedly favor those who master adaptive and intelligent trading strategies, with the Parabolic SAR leading the charge in profit protection.
