Gann Angles for 2026 US Commodity Price Trends: Efficacy Analysis
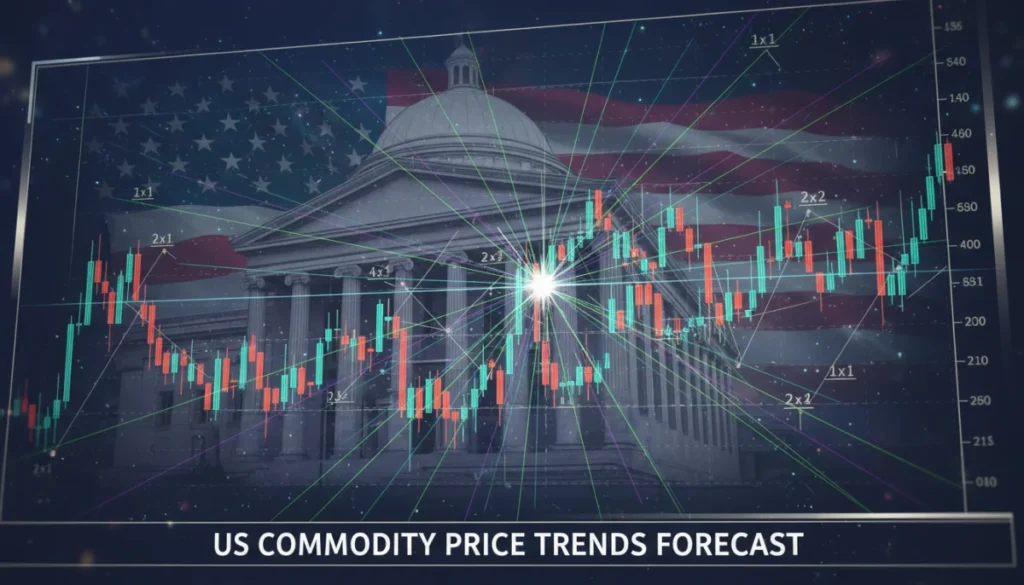
This article critically assesses the historical efficacy of applying Gann Angles to predict US commodity price trends in 2026, providing a comparative analysis of its past performance and potential future relevance.
Understanding the future trajectory of markets is a constant quest for traders and investors. In this context, the method of Gann Angles Commodity Prediction offers a unique, geometrically-based approach to forecasting price movements. This analysis delves into its historical effectiveness and its potential application for anticipating US commodity price trends in 2026.
The foundational principles of Gann Angles
W.D. Gann, a legendary figure in technical analysis, developed a sophisticated system based on geometric angles and time cycles. These angles, drawn from significant price pivots, are believed to represent key support and resistance levels, indicating where price and time converge for potential trend reversals or accelerations. The core idea is that market movements are not random but follow specific mathematical and geometric laws.
Gann’s methodology extends beyond simple trendlines, incorporating the concept that price and time are equally important. He believed that when price moves too quickly or too slowly relative to time, it creates an imbalance that eventually corrects itself. His primary angles, such as 1×1 (45 degrees), 2×1, 1×2, 4×1, and 1×4, represent different rates of price movement over time. For instance, a 1×1 angle suggests that price moves one unit for every one unit of time.
Gann’s geometric and time-based theories
Gann’s theories are deeply rooted in ancient mathematics, astronomy, and geometry. He asserted that natural laws govern market behavior, and these laws can be deciphered through specific geometric patterns and numerical sequences. His work, often considered esoteric, involves not just angles but also squares, circles, and numerical relationships, all aimed at identifying precise turning points.
- Price-Time Equivalence: Gann emphasized that price and time must be considered together, believing that when they are in balance, markets are stable.
- Geometric Angles: Specific angles drawn from swing highs and lows act as support and resistance, indicating trend strength and potential reversals.
- Squaring of Price and Time: A crucial concept where a specific price level aligns with a specific time period, suggesting a significant market event.
- Vibration and Harmonics: Gann believed that markets vibrate at specific frequencies, which can be identified through numerical relationships.
The intricate nature of Gann’s work requires a deep understanding of his methods, often making it challenging for novice traders to implement effectively. However, for those who master it, Gann’s techniques offer a comprehensive framework for market analysis, aiming to predict not just the direction but also the magnitude and timing of market moves. The reliance on historical data patterns to project future movements forms the bedrock of this analytical approach.
Historical efficacy: analyzing past commodity predictions
Assessing the historical efficacy of Gann Angles in predicting commodity prices reveals a mixed record, often characterized by anecdotal successes and statistical challenges. Proponents point to instances where Gann’s methods seemingly pinpointed significant market turning points, leading to substantial profits. These examples often involve major commodity cycles, where the geometric precision of Gann’s angles appeared to align perfectly with price reversals.
However, critics argue that these successes are often cherry-picked, and the subjective nature of drawing Gann Angles makes it difficult to replicate consistently. The interpretation of where to initiate the angles and which specific angles are most relevant can vary significantly among analysts. This subjectivity introduces a degree of discretion that can undermine the objective evaluation of its predictive power. Academic studies on Gann’s methods have yielded inconclusive results, with many finding no statistically significant edge over random market movements.
Case studies in commodity markets
Historically, some traders have claimed remarkable accuracy using Gann Angles in markets like crude oil, gold, and agricultural commodities. For example, a common claim involves identifying major tops and bottoms in crude oil prices during the 1970s and 80s, or predicting significant rallies in gold during periods of economic uncertainty. These analyses often highlight the 1×1 (45-degree) angle as a critical indicator of a sustained trend, with breaches of this angle signaling potential reversals.
- Crude Oil: Alleged accurate predictions of major trend changes based on Gann’s geometric patterns.
- Gold: Identification of significant support and resistance levels using Gann Angles during bull and bear markets.
- Agricultural Commodities: Instances where price cycles in grains or livestock appeared to follow Gann’s time and price squaring principles.
Despite these claims, a rigorous, quantifiable comparison against other technical indicators or fundamental analysis is often lacking. The efficacy of Gann Angles tends to be more evident in hindsight, making real-time application a challenge. The complexity of the system also means that successful application often requires years of dedicated study and practice, making it less accessible than simpler technical tools.
Methodology for applying Gann Angles to US commodities
Applying Gann Angles to US commodity markets involves a systematic approach that combines geometric charting with an understanding of time cycles. The initial step is to identify significant swing highs and swing lows on a price chart, as these points serve as the anchors for drawing the angles. These pivot points should represent clear changes in market direction, signifying the beginning of new trends or the end of existing ones. The choice of pivot points is crucial, as it directly impacts the validity and predictive power of the angles drawn.
Once the pivot points are established, Gann Angles are drawn from these points, typically using a 1×1 (45-degree) angle as the baseline, representing a balanced relationship between price and time. Other angles, such as 2×1 (price moves twice as fast as time) and 1×2 (price moves half as fast as time), are then plotted. These angles create a fan-like structure that is believed to delineate future support and resistance zones. The intersection of these angles with future price movements is where potential turning points are anticipated.
Key steps in drawing and interpreting Gann Angles
The process of correctly drawing and interpreting Gann Angles is paramount for their effective application. It’s not merely about drawing lines; it’s about understanding the underlying principles Gann espoused regarding market rhythm and structure. The scale of the chart, for instance, must be squared, meaning one unit of price must equal one unit of time, a critical but often overlooked aspect of Gann’s original methodology.
- Identify Major Pivots: Locate significant swing highs and lows that represent key turning points in the commodity’s price history.
- Square the Chart: Adjust the chart’s price and time scale so that one unit of price corresponds to one unit of time, ensuring geometric accuracy.
- Draw Base Angles: From the identified pivots, draw the primary 1×1 (45-degree) angle.
- Add Secondary Angles: Plot other important angles like 2×1, 1×2, 4×1, and 1×4 to create a comprehensive fan of support and resistance.
- Interpret Intersections: Observe where price interacts with these angles, looking for bounces, breakthroughs, or reversals, especially at points where multiple angles converge or where price meets a significant time cycle.
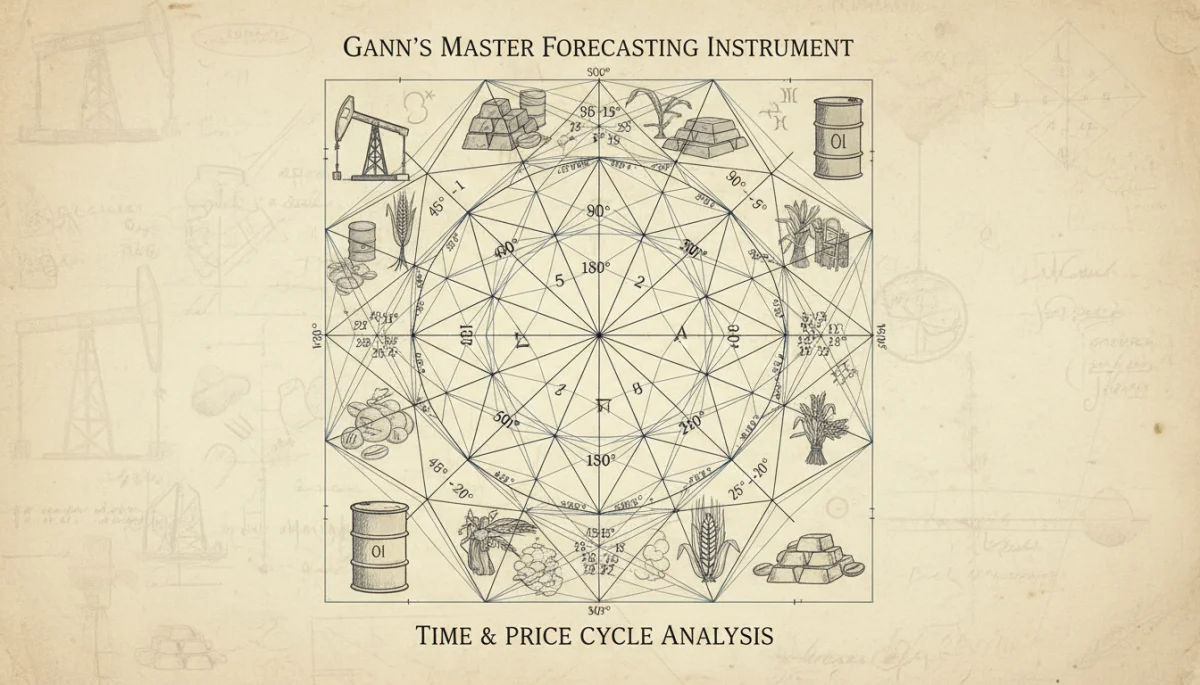
The interpretation of Gann Angles also involves understanding the significance of price breaking through an angle. A break below a support angle, for example, typically signals weakness and a potential move to the next lower angle. Conversely, a break above a resistance angle suggests strength and a potential move to the next higher angle. This dynamic interaction forms the basis for forecasting future price trends and identifying optimal entry and exit points.
Projecting US commodity price trends for 2026
Projecting US commodity price trends for 2026 using Gann Angles requires a careful extrapolation of historical patterns and the identification of current market structures. While 2026 is still some time away, the long-term nature of Gann’s cycles allows for such forward-looking analysis. The process involves examining the broader commodity supercycles, identifying key Gann pivots from past decades, and then extending the relevant angles into the future. This approach assumes that the underlying market geometry and time cycles will continue to exert influence.
Key commodities to consider for this analysis include crude oil, natural gas, gold, silver, corn, wheat, and soybeans, as these often exhibit clear cyclical patterns influenced by fundamental factors and investor sentiment. By carefully mapping out the Gann Angles from significant historical tops and bottoms in these markets, analysts can attempt to identify potential price targets and time windows for major trend reversals or continuations in 2026. The convergence of multiple angles at a specific price and time point is often considered a strong signal.
Factors influencing 2026 commodity outlook
Several fundamental and geopolitical factors will undoubtedly influence US commodity prices in 2026, and these must be considered alongside Gann Angle projections. While Gann’s methods focus on internal market dynamics, external forces can significantly alter the trajectory. Therefore, a holistic approach combining technical insights with macroeconomic analysis is often recommended for more robust forecasts.
- Global Economic Growth: Stronger global growth typically boosts demand for industrial commodities and energy.
- Geopolitical Stability: Conflicts or political instability in key producing regions can impact supply and prices.
- Monetary Policy: Interest rate decisions by central banks, particularly the Federal Reserve, can influence the strength of the US dollar and, consequently, dollar-denominated commodities.
- Climate Change and Weather Patterns: Extreme weather events can severely impact agricultural yields and energy demand.
- Technological Advancements: Innovations in energy production, storage, or agricultural techniques can shift supply-demand dynamics.
The application of Gann Angles to 2026 projections involves a degree of interpretation and the understanding that these are probabilistic forecasts, not certainties. The goal is to identify high-probability zones where significant price action is likely to occur, allowing traders and investors to position themselves accordingly. The ongoing interaction between price and time on the Gann chart will provide continuous updates to these long-term projections.
Comparative analysis: Gann Angles vs. modern technical indicators
A comparative analysis of Gann Angles against modern technical indicators reveals distinct differences in their underlying philosophies and practical applications. While both aim to forecast future price movements, Gann’s methods are rooted in a more esoteric, geometric, and time-based framework, often requiring a subjective interpretation. Modern indicators, such as Moving Averages, Relative Strength Index (RSI), and Stochastic Oscillators, are typically more mathematical, objective, and easily quantifiable.
Modern indicators derive their signals from statistical calculations applied to price and volume data, providing clear buy or sell signals based on predefined thresholds or crossovers. For instance, a golden cross (50-day moving average crossing above 200-day moving average) is a universally understood bullish signal. Gann Angles, conversely, require the analyst to manually draw and interpret lines, which can lead to varying conclusions among different practitioners. This difference in objectivity and ease of use often makes modern indicators more popular among a broader range of traders.
Strengths and weaknesses of each approach
Each analytical approach possesses its own set of strengths and weaknesses, making them suitable for different trading styles and market conditions. Understanding these characteristics is crucial for choosing the most appropriate tool for a given scenario.
- Gann Angles:
- Strengths: Potential for highly precise long-term forecasts of price and time turning points; offers a unique perspective on market structure.
- Weaknesses: Subjectivity in drawing and interpretation; steep learning curve; limited empirical validation; less effective in volatile, directionless markets.
- Modern Technical Indicators:
- Strengths: Objective and quantifiable signals; widely understood and easily implemented; effective in identifying trends, momentum, and overbought/oversold conditions.
- Weaknesses: Often lagging indicators; can generate false signals in choppy markets; may not provide insights into future time-based turning points.
Ultimately, the choice between Gann Angles and modern technical indicators often comes down to personal preference, trading philosophy, and the specific market being analyzed. Many experienced traders advocate for a blended approach, using modern indicators for confirmation of Gann’s broader directional and time-based forecasts. This combination can potentially mitigate the weaknesses of each individual method, leading to more robust trading decisions.
Limitations and challenges in applying Gann Angles
Despite the intriguing potential of Gann Angles, their application comes with significant limitations and challenges that traders must acknowledge. One of the primary difficulties lies in the subjective nature of drawing and interpreting the angles. Unlike many modern indicators that provide clear, objective signals, Gann’s system requires the analyst to make critical decisions regarding the selection of pivot points, the precise scaling of charts, and the interpretation of price interaction with the angles. This subjectivity can lead to different analysts arriving at conflicting conclusions, even when looking at the same chart.
Another major challenge is the steep learning curve associated with mastering Gann’s complete methodology. His work is complex, encompassing not only angles but also squares, circles, and time cycles, all intertwined with esoteric numerical relationships. It often takes years of dedicated study and practice to develop the intuition and precision required to effectively apply his techniques. This complexity makes it less accessible to the average trader compared to more straightforward technical tools.
Overcoming interpretation and data scaling issues
Overcoming the challenges of interpretation and data scaling is crucial for any serious practitioner of Gann Angles. The proper scaling of a chart, where one unit of price equals one unit of time, is fundamental to Gann’s geometric principles, yet it is frequently overlooked or misunderstood. Incorrect scaling can render the drawn angles meaningless, as their geometric integrity is compromised. Traders must meticulously ensure their charting software is configured to maintain this price-time equivalence.
- Consistent Pivot Selection: Develop a consistent methodology for identifying significant swing highs and lows to reduce subjectivity.
- Precise Chart Scaling: Always ensure the chart’s price and time axes are squared, maintaining the correct ratio for accurate angle drawing.
- Backtesting and Validation: Rigorously backtest Gann Angle applications on historical data to build confidence in their predictive power under various market conditions.
- Combine with Other Tools: Use Gann Angles in conjunction with other technical or fundamental analysis tools to confirm signals and mitigate individual method weaknesses.
- Continuous Learning: Engage in ongoing study of Gann’s original works and successful applications by experienced practitioners to refine interpretation skills.
Furthermore, the lack of widespread empirical validation from academic studies also poses a challenge to its credibility among institutional investors. While anecdotal evidence of success abounds, the absence of statistically significant proof makes it difficult to universally recommend Gann Angles as a standalone predictive tool. Therefore, a cautious and complementary approach, integrating Gann’s insights with more conventional analysis, is often the most prudent strategy.
The future of Gann Angles in commodity forecasting
The future of Gann Angles in commodity forecasting remains a subject of ongoing debate and fascination within the technical analysis community. While modern quantitative methods and AI-driven algorithms increasingly dominate financial markets, the timeless, geometric principles espoused by W.D. Gann continue to attract a dedicated following. For 2026 and beyond, Gann Angles are likely to retain their niche appeal, particularly among traders who seek a deeper, more holistic understanding of market movements beyond conventional indicators.
The enduring relevance of Gann’s work lies in its unique ability to integrate price and time, offering a framework that attempts to predict not just price levels but also the exact timing of market turns. As markets become more complex and interconnected, the ability to identify precise time-based turning points could become an even more valuable asset. However, for Gann Angles to gain broader acceptance, there may need to be advancements in objective application and validation, perhaps through sophisticated algorithmic interpretations of his geometric principles.
Integrating Gann with advanced analytics for 2026
The most promising path for the future of Gann Angles in commodity forecasting might involve their integration with advanced analytical tools and technologies. While Gann’s original methods are manual and subjective, the underlying principles of price-time relationships and geometric harmony could be adapted for modern computational analysis. This could involve using machine learning to identify optimal pivot points, automate chart squaring, and objectively interpret angle interactions.
- Algorithmic Gann Implementation: Developing algorithms that can automatically draw and interpret Gann Angles based on predefined rules, reducing human subjectivity.
- AI-Driven Pivot Identification: Utilizing artificial intelligence to identify the most significant swing highs and lows, improving the accuracy of angle placement.
- Pattern Recognition: Employing machine learning to recognize recurring Gann patterns and their predictive outcomes across various commodity markets.
- Hybrid Models: Creating forecasting models that combine Gann’s geometric insights with statistical methods and fundamental analysis for more robust predictions.
- Visualization Tools: Developing advanced charting platforms that simplify the process of drawing and interacting with Gann Angles, making them more accessible.
Ultimately, the continued relevance of Gann Angles in 2026 and beyond will depend on the ability of practitioners to bridge the gap between its historical, often esoteric, foundations and the demands of modern, data-driven financial analysis. By embracing technology and seeking objective validation, Gann’s profound insights into market structure and rhythm could find new avenues for application in predicting commodity price trends.
| Key Aspect | Brief Description |
|---|---|
| Gann Angles Core | Geometric lines identifying price-time support/resistance from swing pivots. |
| Historical Efficacy | Mixed results with anecdotal successes but challenging statistical validation. |
| Application Challenges | Subjectivity in drawing, chart scaling, and steep learning curve. |
| 2026 Outlook | Potential for integration with AI to enhance objectivity and accessibility. |
Frequently asked questions about Gann Angles and commodity prediction
Gann Angles are geometric lines drawn from significant price pivots on a chart, representing specific rates of price movement over time. They are used to identify potential support and resistance levels, as well as future price and time turning points in commodity markets, based on the principle of price-time equivalence.
The reliability of Gann Angles for 2026 US commodity price prediction is debated. While some traders report success, their subjective nature and lack of widespread empirical validation make consistent, objective forecasting challenging. They are best used as a complementary tool rather than a standalone predictive method.
Key challenges include the high subjectivity in selecting pivot points and drawing angles, the crucial need for accurate chart scaling (squaring of price and time), and the steep learning curve associated with Gann’s complex methodology. Misinterpretation can lead to inaccurate forecasts.
Yes, combining Gann Angles with other technical analysis tools, such as moving averages, RSI, or fundamental analysis, is highly recommended. This integrated approach can help confirm signals, mitigate the weaknesses of individual methods, and provide a more robust and comprehensive market outlook.
Gann Angles are unique due to their geometric, time-based, and often subjective nature, aiming to predict precise price and time turning points. Modern indicators are typically more mathematical, objective, and statistically driven, focusing on quantifiable signals like momentum, trend strength, and overbought/oversold conditions.
Conclusion
The application of Gann Angles to predict US commodity price trends in 2026 presents a fascinating, albeit challenging, avenue for market analysis. While historical efficacy offers a mixed picture, with anecdotal successes contrasting with difficulties in objective validation, the underlying principles of price-time equivalence and geometric harmony continue to intrigue. For those willing to invest in the rigorous study required, Gann’s methods provide a unique lens through which to view market structure and potential turning points. As we approach 2026, the strategic integration of Gann Angles with modern analytical tools and a comprehensive understanding of macroeconomic factors may offer a more robust framework for navigating the complexities of US commodity markets. Ultimately, the enduring legacy of Gann lies in his profound, if challenging, insights into the rhythmic nature of financial markets.
