2026 Guide to Bollinger Band Squeezes: US Market Breakouts
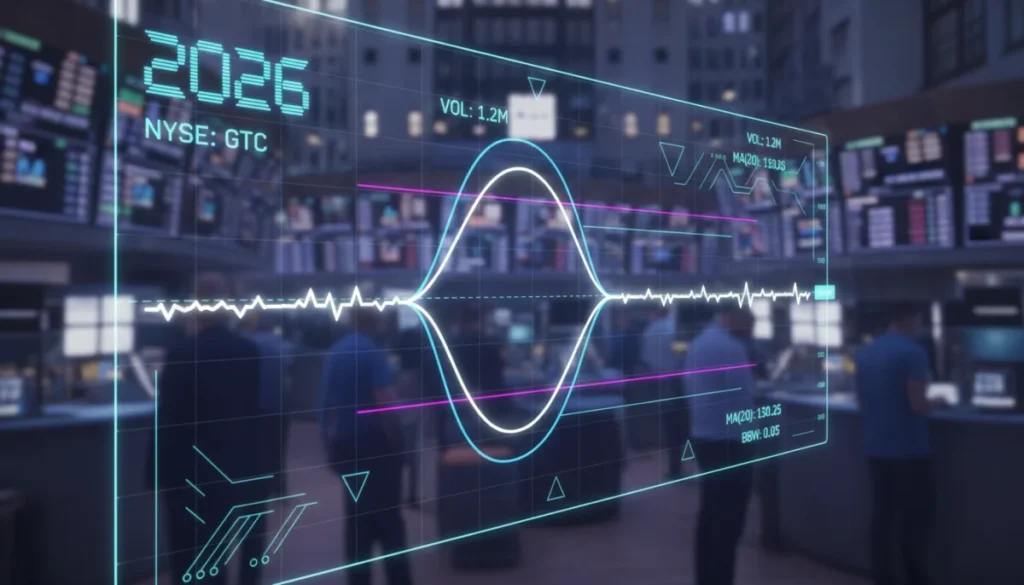
Utilizing Bollinger Band Squeezes in 2026 offers a potent strategy for identifying high-probability breakouts in the US market by signaling periods of contracting volatility before explosive price movements.
The year 2026 presents a unique landscape for traders seeking high-probability opportunities in the US market. This guide, The 2026 Guide to Utilizing Bollinger Band Squeezes for US Market Breakouts: A Time-Sensitive Opportunity, delves into a powerful technical analysis tool that can help you identify and capitalize on significant price movements. Are you ready to refine your trading strategy?
Understanding Bollinger Bands and Their Core Mechanics
Bollinger Bands are a widely used technical analysis tool developed by John Bollinger. They consist of a simple moving average (SMA) in the middle, and two outer bands that are standard deviations from the SMA. The key insight is that these bands dynamically adjust to market volatility, expanding during periods of high volatility and contracting during periods of low volatility. This dynamic nature makes them invaluable for identifying potential shifts in market behavior.
At their core, Bollinger Bands provide a relative definition of high and low prices. Prices are considered high when they are near the upper band and low when they are near the lower band. However, the true power of Bollinger Bands often lies in observing their width, which directly reflects market volatility. When the bands narrow significantly, it signals a period of low volatility, often preceding a substantial price move in either direction.
The Statistical Basis of Bollinger Bands
The standard deviation component is crucial. Typically, the bands are set two standard deviations away from the 20-period SMA. This means that, statistically, approximately 95% of price action should occur within these bands. When prices move outside the bands, it’s considered a significant event, often indicating overbought or oversold conditions, or the beginning of a new trend. Understanding this statistical underpinning helps traders interpret the signals more effectively.
- Middle Band: A 20-period Simple Moving Average, representing the intermediate-term trend.
- Upper Band: Two standard deviations above the middle band, indicating higher price levels.
- Lower Band: Two standard deviations below the middle band, indicating lower price levels.
- Dynamic Volatility: Bands widen with increased volatility and narrow with decreased volatility.
In summary, Bollinger Bands offer a robust framework for assessing price volatility and identifying potential turning points or continuations in market trends. Their ability to adapt to changing market conditions makes them a versatile tool for both short-term and long-term traders.
Identifying Bollinger Band Squeezes: The Precursor to Breakouts
A Bollinger Band Squeeze occurs when the upper and lower bands contract sharply, moving closer to the middle band. This narrowing indicates a significant decrease in market volatility, suggesting that the market is consolidating and building energy for a major price move. Identifying these squeezes early is paramount for traders looking to position themselves before a breakout.
The squeeze itself doesn’t tell you the direction of the impending breakout, only that a breakout is likely. It acts as a warning signal, alerting traders to pay close attention. The tighter the squeeze, the more significant the subsequent breakout tends to be. This phenomenon is often seen across various asset classes, including stocks, commodities, and currencies, making it a universal pattern for technical analysts.
Visual Cues and Confirmation Indicators
Visually, a squeeze is evident when the bands appear to pinch together, almost parallel to each other. Traders often combine Bollinger Bands with other indicators to confirm the direction of the breakout. Volume is a particularly useful companion. A breakout accompanied by a surge in volume lends stronger credibility to the move, indicating institutional participation and conviction.
- Band Width Indicator: Many charting platforms offer a separate indicator that measures the distance between the upper and lower Bollinger Bands. A declining band width confirms a squeeze.
- Price Consolidation: During a squeeze, price action typically becomes very tight, often forming patterns like triangles, rectangles, or flags.
- Low Volume: Squeezes are often characterized by decreasing trading volume, reflecting a lack of conviction from both buyers and sellers before the breakout.
- Momentum Oscillators: Oscillators like RSI or MACD can help confirm the underlying momentum building up during the squeeze, though they typically show flat or neutral readings.
Recognizing a Bollinger Band Squeeze is the first critical step in anticipating a market breakout. It shifts a trader’s focus from current price action to the potential for future explosive moves, providing a strategic advantage in volatile markets.
Strategic Entry and Exit Points for Breakout Trading
Once a Bollinger Band Squeeze has been identified, the next challenge is to determine optimal entry and exit points. This requires patience and a clear understanding of confirmation signals. Entering too early can lead to false breakouts, while entering too late might mean missing a significant portion of the move. The key is to wait for clear signals that the breakout has truly begun.
A common strategy is to enter a trade when the price closes outside an engulfing Bollinger Band, particularly when accompanied by increased volume. For an upward breakout, this means a strong close above the upper band. For a downward breakout, it would be a close below the lower band. These initial moves often signify the start of a sustained trend.
Managing Risk and Setting Stop-Losses
Risk management is paramount in breakout trading. Breakouts can be volatile, and false signals are always a possibility. Setting appropriate stop-loss orders is crucial to protect capital. A common approach is to place a stop-loss just inside the Bollinger Band on the opposite side of the breakout, or below a recent swing low for upward breakouts, and above a recent swing high for downward breakouts.
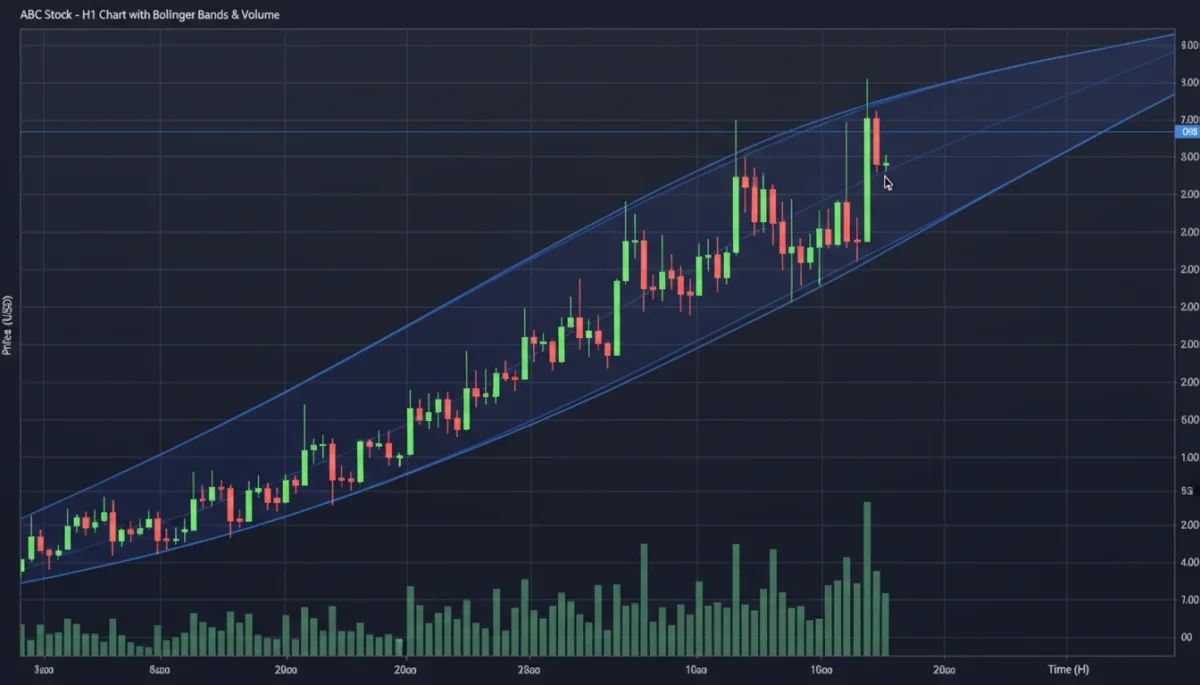
Exiting a trade can be just as important as entering. Traders might use profit targets based on previous resistance/support levels, or trail their stop-loss as the price moves in their favor. Another exit strategy involves waiting for the price to re-enter the Bollinger Bands, which can signal a loss of momentum or the end of the breakout move. Some traders also use a reversal of a momentum indicator as an exit signal.
In summary, successful breakout trading using Bollinger Band Squeezes hinges on precise timing for entry, robust risk management with well-placed stop-loss orders, and a disciplined approach to taking profits. Combining these elements provides a comprehensive trading strategy.
Bollinger Band Squeezes in the 2026 US Market Landscape
The 2026 US market is expected to exhibit dynamic shifts, influenced by evolving economic policies, technological advancements, and geopolitical factors. These conditions often create periods of consolidation followed by strong directional moves, making Bollinger Band Squeezes particularly relevant. Identifying sectors or individual stocks exhibiting these patterns can offer significant advantages.
Analyzing historical market behavior can provide valuable insights into how squeezes have played out in different economic environments. While past performance is not indicative of future results, understanding the typical response of various market segments to volatility compression can inform current strategies. For instance, growth stocks might show more explosive breakouts from squeezes compared to value stocks during certain market cycles.
Sector-Specific Opportunities and Macroeconomic Context
In 2026, specific sectors like AI, renewable energy, and biotechnology are likely to experience heightened periods of innovation and consolidation, making them prime candidates for Bollinger Band Squeeze identification. Monitoring the broader macroeconomic context, such as interest rate expectations or inflation trends, can help anticipate which sectors might be poised for a breakout.
- Technology Sector: Rapid innovation often leads to periods of uncertainty and consolidation, followed by significant breakthroughs and stock rallies.
- Healthcare and Biotech: New drug approvals or research milestones can trigger sharp price movements after periods of accumulation.
- Energy Transition: Companies involved in renewable energy and sustainable technologies may experience volatility as policies and adoption rates evolve.
- Financials: Interest rate changes and economic growth forecasts can lead to strong directional moves in banking and financial services stocks.
Ultimately, applying Bollinger Band Squeeze analysis in 2026 requires not just technical prowess but also an awareness of the underlying fundamental and macroeconomic drivers shaping the US market. This holistic approach can significantly enhance the effectiveness of the strategy.
Combining Bollinger Squeezes with Other Technical Indicators
While Bollinger Band Squeezes are powerful on their own, their effectiveness can be significantly amplified when combined with other technical indicators. This multi-indicator approach helps to filter out false signals, confirm breakout direction, and provide a more robust trading edge. The goal is to build a confluence of evidence supporting a potential trade.
Volume is perhaps the most critical companion indicator. A breakout from a squeeze without a corresponding surge in volume should be treated with caution, as it may lack conviction. Conversely, a strong increase in volume confirms that significant buying or selling pressure is behind the move, increasing the probability of a sustained trend.
Momentum and Trend-Following Indicators
Momentum oscillators like the Relative Strength Index (RSI) or the Moving Average Convergence Divergence (MACD) can provide additional confirmation. During a squeeze, these indicators typically hover around their neutral levels. A breakout in price should be accompanied by a strong move in the momentum indicator in the same direction, signaling growing strength behind the trend.
- Volume Profile: Helps identify areas of high accumulation or distribution during the squeeze, indicating where significant price barriers might exist.
- Average Directional Index (ADX): Can be used to confirm the strength of the trend once a breakout has occurred. A rising ADX signifies a strengthening trend.
- Candlestick Patterns: Specific bullish or bearish candlestick patterns appearing at the point of breakout can offer further confirmation of the likely direction.
- Support and Resistance Levels: Horizontal support and resistance levels can serve as both targets and additional confirmation points for breakouts.
By integrating Bollinger Band Squeezes with a carefully selected set of complementary indicators, traders can refine their analysis, increase their confidence in trade setups, and ultimately improve their overall trading performance in the dynamic 2026 market.
Common Pitfalls and How to Avoid Them
While Bollinger Band Squeezes offer a lucrative strategy, traders must be aware of common pitfalls that can lead to losses. Avoiding these traps is as important as identifying the squeezes themselves. Discipline, patience, and a strong understanding of market dynamics are essential to navigate these challenges successfully.
One of the most frequent issues is the false breakout. This occurs when the price briefly moves outside the bands, only to quickly reverse and move back into the consolidation range. False breakouts can trap traders who enter too eagerly, leading to stop-loss triggers and frustration. Waiting for a confirmed close outside the bands and observing accompanying volume can help mitigate this risk.
Overtrading and Lack of Patience
Another common mistake is overtrading. Not every squeeze will result in a profitable breakout, and not every breakout will be significant. Traders might feel compelled to take every potential signal, leading to increased transaction costs and emotional fatigue. Patience is key; waiting for the highest probability setups will yield better results in the long run.
- Ignoring Volume Confirmation: Entering a breakout trade without validating it with increased volume is a recipe for false signals.
- Lack of Stop-Loss Orders: Failing to implement strict stop-loss orders can lead to significant capital erosion during unexpected reversals.
- Not Adapting to Market Conditions: The effectiveness of squeezes can vary with different market regimes (e.g., bull vs. bear markets). Traders must adjust their interpretation accordingly.
- Confirmation Bias: Only looking for signals that confirm a preconceived notion about market direction, rather than objectively assessing all available evidence.
By being mindful of these common pitfalls and adopting a disciplined, patient, and analytical approach, traders can significantly improve their success rate when utilizing Bollinger Band Squeezes for US market breakouts in 2026. Continuous learning and adaptation are vital in the ever-changing financial markets.
Optimizing Strategies for 2026: A Time-Sensitive Opportunity
The year 2026 presents a unique window for leveraging Bollinger Band Squeezes. Market conditions are constantly evolving, and what worked perfectly last year might need refinement for the current environment. Optimizing your strategy means staying agile, continuously learning, and adapting to the specific nuances of the US market in the coming years.
Consider the impact of emerging technologies and global economic shifts. For instance, the increasing adoption of AI and automation could lead to unprecedented volatility in certain tech segments, creating fertile ground for squeeze-based strategies. Similarly, shifts in monetary policy by the Federal Reserve could induce periods of consolidation followed by strong directional moves across broader indices.
Backtesting and Continuous Refinement
To truly optimize your Bollinger Band Squeeze strategy for 2026, rigorous backtesting is indispensable. Apply your identified patterns and rules to historical data from relevant timeframes and market conditions. This empirical approach will help you understand the profitability and reliability of your strategy over time, allowing for data-driven adjustments.
- Adjusting Parameters: Experiment with different standard deviation multiples or SMA periods for the Bollinger Bands to find what works best for specific assets or timeframes in 2026.
- Diversifying Asset Classes: Don’t limit the strategy to just stocks; explore commodities, forex, or cryptocurrencies if they fit your risk profile and offer similar squeeze opportunities.
- Stay Informed: Keep abreast of macroeconomic news, corporate earnings, and geopolitical events that could impact market volatility and trigger breakouts.
- Psychological Preparedness: Develop a strong trading psychology to handle the inevitable false signals and drawdowns that are part of any breakout strategy.
By proactively optimizing your approach and remaining attuned to the dynamic forces at play, traders can transform Bollinger Band Squeezes into a highly effective tool for capturing significant market breakouts throughout 2026. This time-sensitive opportunity demands a forward-looking and adaptable mindset.
| Key Aspect | Brief Description |
|---|---|
| Bollinger Squeeze | Narrowing of Bollinger Bands signaling low volatility and impending price explosion. |
| Breakout Confirmation | Price closing outside bands with increased volume confirms direction. |
| Risk Management | Crucial for setting stop-losses to protect capital against false breakouts. |
| 2026 Relevance | Adapting strategy to 2026’s unique market drivers for optimal performance. |
Frequently Asked Questions About Bollinger Band Squeezes
A Bollinger Band Squeeze occurs when the upper and lower Bollinger Bands contract tightly around the middle moving average. This signals a period of exceptionally low market volatility, often preceding a significant price movement or breakout in either direction as market energy builds up.
Confirmation of a breakout typically involves observing the price closing decisively outside one of the Bollinger Bands. Crucially, this price action should be accompanied by a noticeable increase in trading volume, indicating strong conviction behind the new directional move. Without volume, it might be a false signal.
No, a Bollinger Band Squeeze primarily signals that a significant price move is imminent, but it does not inherently predict the direction. Traders must wait for the price to break out of the bands, along with confirming indicators like volume, to determine whether the breakout will be upward or downward.
To enhance accuracy, combine Bollinger Band Squeezes with volume indicators to confirm conviction. Momentum oscillators like RSI or MACD can also provide additional insight into the strength of the move. Chart patterns, such as triangles or flags, often form during a squeeze, offering further clues.
Bollinger Band Squeezes are most effective in trending or consolidating markets where volatility compression is common. They may be less reliable in extremely choppy or sideways markets without clear directional bias. Adapting the strategy to prevailing market conditions and specific assets is crucial for optimal results.
Conclusion
The 2026 US market offers a fertile ground for traders who master the art of utilizing Bollinger Band Squeezes. By understanding their mechanics, identifying genuine squeeze formations, and confirming breakouts with supplementary indicators, investors can position themselves advantageously. While no strategy is foolproof, a disciplined approach, combined with robust risk management and continuous adaptation to evolving market dynamics, makes Bollinger Band Squeezes a powerful tool for capturing significant price movements. This guide has provided a comprehensive framework to help you navigate these time-sensitive opportunities, empowering you to make more informed and strategic trading decisions in the coming years.
