Ichimoku Cloud vs. MACD: US Sector Rotation in 2026 Analysis
The comparison of Ichimoku Cloud and MACD for US sector rotation in 2026 involves evaluating their distinct technical analysis methodologies to identify optimal entry and exit points, thereby informing strategic investment decisions.
Navigating the complexities of the financial markets requires robust analytical tools. This article delves into a data-backed analysis for financial impact, specifically comparing Ichimoku Cloud vs. MACD for US sector rotation in 2026, offering insights into their utility for investors.
Understanding sector rotation and its importance
Sector rotation is a strategic approach in investing that involves shifting investment allocations among different sectors of the economy. This strategy is predicated on the idea that various economic sectors perform differently at various stages of the business cycle. Identifying these shifts early can lead to significant outperformance.
In the context of the US market, sector rotation becomes particularly vital due to the diverse nature of its economy and the rapid technological advancements that can quickly alter sector prospects. Investors constantly seek indicators that can provide an edge in predicting these movements, aiming to capitalize on sectors poised for growth while avoiding those facing headwinds.
The cyclical nature of economic sectors
- Early Cycle: Typically favors financial, consumer discretionary, and technology sectors.
- Mid Cycle: Industrial and materials sectors often show strength.
- Late Cycle: Energy, healthcare, and consumer staples tend to perform well.
- Recession: Utilities and consumer staples are often seen as defensive plays.
The ability to accurately forecast these rotational shifts is paramount. Technical indicators play a crucial role in this, providing visual and mathematical methods to gauge market sentiment and momentum. Without effective tools, investors risk being reactive rather than proactive, potentially missing out on lucrative opportunities or suffering unnecessary losses.
Ultimately, a deep understanding of sector rotation, combined with reliable analytical tools, empowers investors to make informed decisions. As we look towards 2026, the dynamic nature of global and domestic economic factors will likely make accurate sector timing more critical than ever, emphasizing the need for a thorough comparison of leading indicators.
Ichimoku Cloud: a comprehensive overview
The Ichimoku Cloud, or Ichimoku Kinko Hyo, is a Japanese technical analysis charting method used to predict future price momentum and define future areas of support and resistance. It provides a comprehensive view of market trends, often described as an “at-a-glance” indicator due to its multifaceted components.
Developed by Goichi Hosoda, a Japanese journalist, in the late 1930s, the Ichimoku Cloud was made public in 1969. Its complexity can initially seem daunting, but its various lines and the cloud itself offer a rich tapestry of information about market conditions, including trend direction, momentum, and potential reversal points.
Key components of the Ichimoku Cloud
- Tenkan-Sen (Conversion Line): A nine-period moving average, representing short-term momentum.
- Kijun-Sen (Base Line): A 26-period moving average, indicating medium-term momentum.
- Senkou Span A (Leading Span A): The average of the Tenkan-Sen and Kijun-Sen, plotted 26 periods ahead, forming one boundary of the cloud.
- Senkou Span B (Leading Span B): The average of the highest high and lowest low over the past 52 periods, plotted 26 periods ahead, forming the other boundary of the cloud.
- Chikou Span (Lagging Span): The current closing price plotted 26 periods behind, indicating price momentum relative to past prices.
The cloud itself, formed by Senkou Span A and B, is perhaps the most distinctive feature. A rising cloud (Senkou Span A above Senkou Span B) indicates bullish sentiment, while a falling cloud (Senkou Span A below Senkou Span B) suggests bearish sentiment. The thickness of the cloud often correlates with the volatility and strength of the trend.
Traders utilize crossovers between the Tenkan-Sen and Kijun-Sen, price action relative to these lines and the cloud, and the position of the Chikou Span to generate trading signals. Its ability to project support and resistance levels into the future makes it a powerful tool for strategic planning, especially in dynamic markets like US sector rotation.
MACD: simplicity and effectiveness for trend identification
The Moving Average Convergence Divergence (MACD) is a momentum indicator that shows the relationship between two moving averages of a security’s price. It is one of the most popular and widely used technical indicators, beloved for its simplicity and effectiveness in identifying trend changes and momentum shifts.
Developed by Gerald Appel in the late 1970s, MACD is categorized as an oscillator, meaning it fluctuates above and below a centerline with no upper or lower limits. Its primary function is to reveal changes in the strength, direction, momentum, and duration of a trend in a stock’s price.
How MACD is calculated and interpreted
The MACD line is calculated by subtracting the 26-period Exponential Moving Average (EMA) from the 12-period EMA. A nine-period EMA of the MACD line, known as the “signal line,” is then plotted on top of the MACD line, acting as a trigger for buy and sell signals. The histogram, the third component, represents the difference between the MACD line and the signal line.
When the MACD line crosses above the signal line, it is typically a bullish signal, suggesting upward momentum. Conversely, when the MACD line crosses below the signal line, it is a bearish signal, indicating downward momentum. Divergences between the MACD and price action can also signal potential trend reversals.
One of MACD’s strengths lies in its ability to be used across various timeframes, making it suitable for both short-term traders and long-term investors. Its straightforward interpretation makes it an accessible tool for many, yet its predictive power is considerable when combined with other forms of analysis.
For sector rotation, MACD can be particularly useful in confirming the strength of a new trend in a sector or signaling the weakening of an existing one. Its responsiveness to price changes can help investors identify when a sector is gaining or losing momentum, aiding in timely allocation decisions.
Data-backed analysis: historical performance in US sector rotation
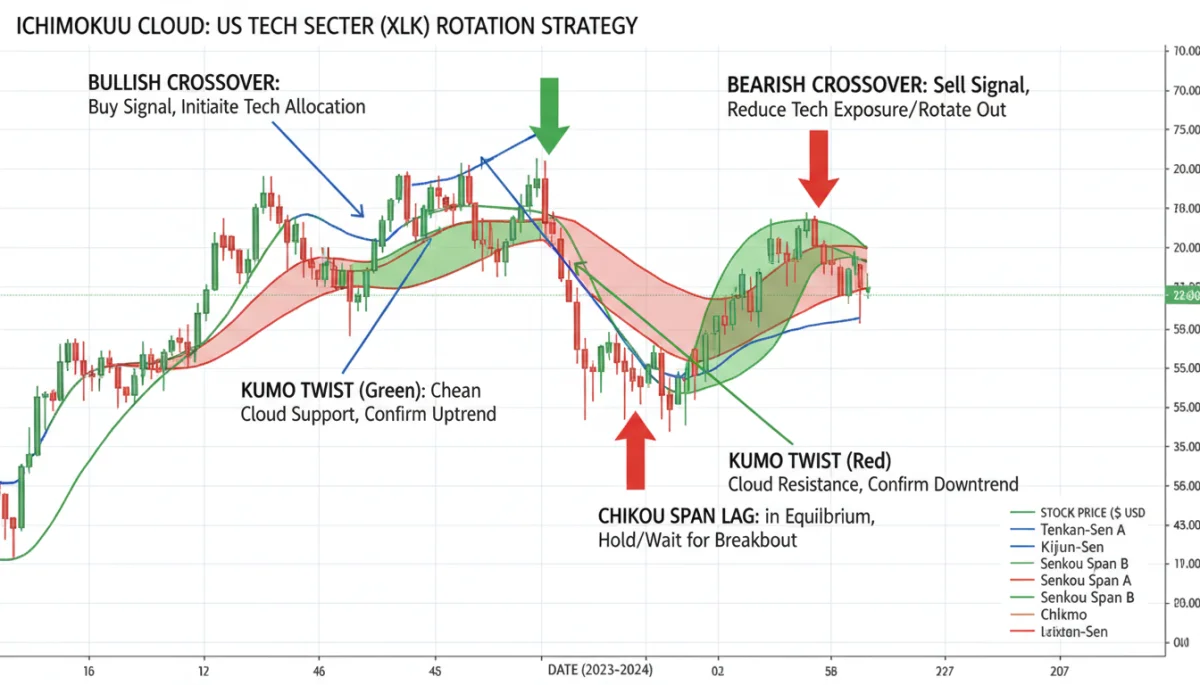
To truly understand the efficacy of Ichimoku Cloud and MACD for US sector rotation, a look at historical performance is indispensable. While both indicators are widely used, their strengths and weaknesses become evident when subjected to rigorous data analysis over different market cycles.
Studies have shown that no single indicator is perfect for all market conditions. However, examining how each indicator has performed in identifying shifts between sectors in the past can provide valuable insights into their potential utility for 2026.
Ichimoku Cloud’s historical insights
Historically, the Ichimoku Cloud has demonstrated its strength in identifying strong trends and providing clear support and resistance levels. Its ability to project these levels 26 periods into the future offers a unique advantage for long-term strategic planning in sector rotation.
- Trend Confirmation: Price remaining above a bullish cloud, or below a bearish cloud, often confirms strong sector trends, indicating periods of sustained outperformance or underperformance.
- Reversal Signals: Kumo twists (where Senkou Span A and B cross) have often preceded significant trend reversals in sector performance.
- Lagging Span’s Role: The Chikou Span crossing above or below the price 26 periods ago has historically provided confirmation of new sector momentum.
However, the Ichimoku Cloud can produce numerous false signals in choppy or range-bound markets, where clear trends are absent. This necessitates combining it with other analytical methods or focusing its application on sectors exhibiting clear directional movement.
MACD’s historical insights
MACD, on the other hand, has historically excelled in identifying momentum shifts and trend changes with relative simplicity. Its crossover signals are often considered reliable for confirming the initiation or termination of a sector’s upward or downward trajectory.
- Momentum Shifts: MACD line crossing the signal line has frequently coincided with the beginning of a new sector trend, making it useful for early entry into rotating sectors.
- Divergence as Warning: Bearish or bullish divergences between MACD and sector price action have served as early warning signs of impending trend reversals, allowing for timely exit or entry.
- Histogram’s Value: The histogram growing or shrinking has provided a visual representation of the strength of momentum, aiding in confirming the conviction behind a sector’s move.
While MACD is effective, it can also generate whipsaws in highly volatile markets, leading to premature signals. Its lag, being based on moving averages, means it might not always capture the absolute peak or trough of a sector’s movement. Therefore, understanding its limitations alongside its strengths is crucial for its effective application in sector rotation.
Strategic application for US sector rotation in 2026
As we look towards 2026, the application of Ichimoku Cloud and MACD in US sector rotation demands a strategic, nuanced approach. The economic landscape will likely be influenced by various factors, including technological advancements, geopolitical developments, and evolving monetary policies. Therefore, a flexible and informed strategy is crucial.
Neither indicator should be used in isolation. Instead, combining their strengths can provide a more robust framework for making allocation decisions. The Ichimoku Cloud can offer a broader, long-term perspective on sector trends and future support/resistance, while MACD can provide timely signals for momentum shifts and potential entry/exit points within those trends.
Integrating Ichimoku Cloud and MACD
One effective strategy involves using the Ichimoku Cloud to identify the overarching trend of a sector. If a sector’s price is consistently above a bullish cloud, it suggests a strong uptrend. Within this confirmed uptrend, MACD can then be employed to pinpoint optimal entry points when bullish crossovers occur after pullbacks.
Conversely, if a sector’s price falls below a bearish cloud, indicating a downtrend, MACD bearish crossovers can be used to confirm the continued weakness or to identify short-selling opportunities if permissible. This layered approach helps filter out false signals that either indicator might generate on its own.
Furthermore, divergences between MACD and price action within a sector that is approaching the Ichimoku Cloud’s boundaries can be particularly powerful. For instance, a bearish MACD divergence as price approaches the top of a bullish cloud might signal a potential Kumo twist or a weakening of the trend, prompting caution.
Considering the potential for increased market volatility in 2026, a multi-indicator strategy reduces reliance on any single signal, enhancing the overall reliability of sector rotation decisions. Regular backtesting and forward-testing with real-time data will also be essential to adapt these strategies to prevailing market conditions.
Potential financial impact and risk management
The successful application of Ichimoku Cloud and MACD in US sector rotation for 2026 can have a significant financial impact, potentially leading to enhanced portfolio returns and improved risk management. By accurately identifying strong sectors and avoiding weak ones, investors can optimize their capital allocation strategies.
However, it is crucial to recognize that no technical indicator guarantees profits, and all trading strategies carry inherent risks. Effective risk management is therefore paramount, regardless of the sophistication of the analytical tools employed.
Maximizing returns with indicator synergy
- Early Trend Identification: Combining the long-term trend confirmation of Ichimoku with MACD’s momentum signals can allow for earlier entry into sectors poised for growth, maximizing upside potential.
- Timely Exits: Bearish signals from either indicator, especially when confirmed by the other, can facilitate timely exits from underperforming sectors, preserving capital and locking in gains.
- Reduced Emotional Trading: A systematic approach based on these indicators can help reduce emotional decision-making, leading to more disciplined and objective trading.
While the potential for increased returns is clear, investors must also focus on mitigating risks. This involves setting clear stop-loss levels, diversifying across multiple sectors, and avoiding over-leveraging. The market in 2026 will likely present both opportunities and challenges, and a well-defined risk management plan will be essential.
Furthermore, continuous monitoring and adaptation of the chosen strategy are vital. Economic conditions, technological shifts, and investor sentiment can change rapidly, requiring investors to reassess their indicator parameters and sector allocations regularly. The financial impact of these tools is directly linked to the discipline and adaptability of the investor.
| Indicator | Primary Strength for Sector Rotation |
|---|---|
| Ichimoku Cloud | Comprehensive trend identification, future support/resistance projection. |
| MACD | Momentum shifts, trend changes, and divergence signals. |
| Combined Strategy | Enhanced signal reliability, reduced false positives, balanced perspective. |
| Risk Management | Essential for capital preservation and adapting to market volatility. |
Frequently asked questions about Ichimoku Cloud and MACD
Ichimoku Cloud is a comprehensive trend-following system providing support/resistance, trend direction, and momentum, often projecting future levels. MACD is a momentum oscillator focused on the relationship between two moving averages, primarily identifying trend strength and reversals through crossovers and divergences.
Yes, both indicators can be adapted for short-term analysis by adjusting their parameters to shorter timeframes. MACD is generally more reactive to short-term momentum shifts, while Ichimoku Cloud can still provide structural clarity, even on shorter charts, by identifying trend strength.
Both indicators offer reversal signals. Ichimoku Cloud’s Kumo twists and price breaking through the cloud often signal significant reversals. MACD’s divergences between price and indicator, along with signal line crossovers, are also strong indicators of impending trend changes.
Yes, Ichimoku Cloud can produce false signals in choppy markets and its complexity can be a barrier for new users. MACD can also generate whipsaws in volatile conditions and, being a lagging indicator, might not catch absolute peaks or troughs. Both are best used with other forms of analysis.
Backtesting allows investors to evaluate how Ichimoku Cloud and MACD strategies would have performed on historical data. This helps in optimizing indicator parameters, understanding their strengths and weaknesses in different market conditions, and building confidence in the strategy for future application in 2026.
Conclusion
The comparative analysis of Ichimoku Cloud and MACD reveals that both are powerful technical indicators, each with unique strengths for navigating US sector rotation in 2026. While Ichimoku offers a comprehensive, forward-looking view of trends and support/resistance, MACD excels in identifying momentum shifts and trend reversals with greater simplicity. The optimal strategy for investors lies in understanding their individual characteristics and, more importantly, in combining them to create a more robust and reliable analytical framework. This synergistic approach, coupled with diligent risk management and continuous adaptation to market dynamics, holds the key to potentially enhancing financial impact and achieving successful sector rotation outcomes in the evolving economic landscape.
