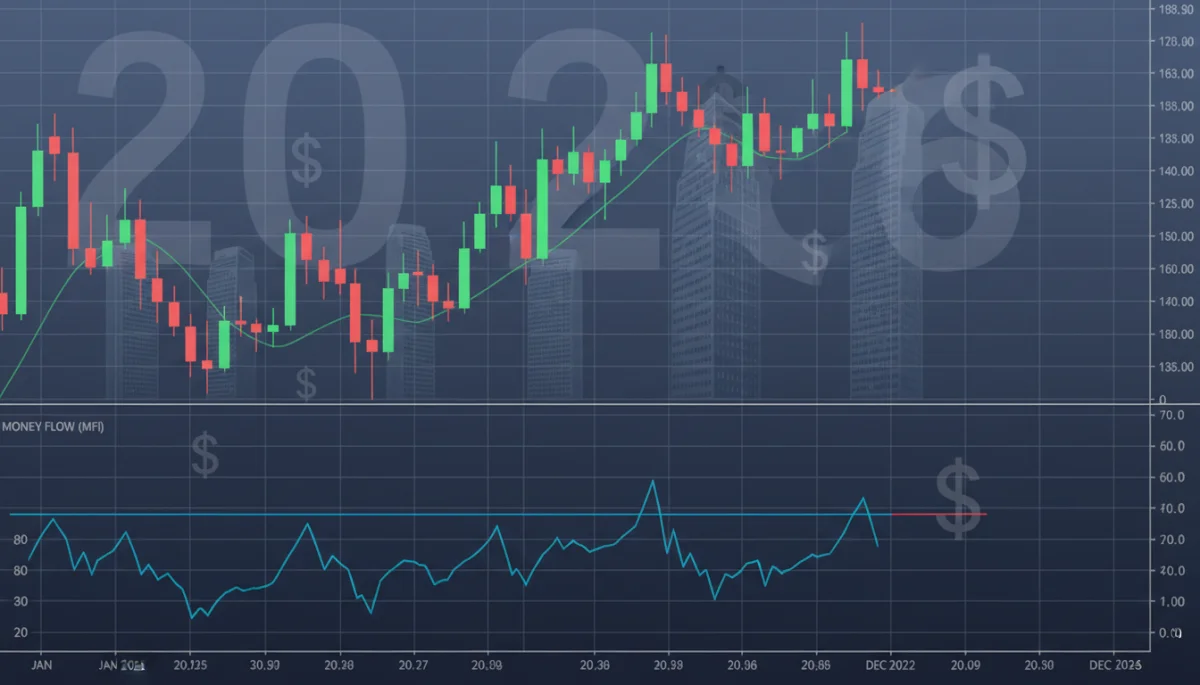
MFI: Spotting Institutional Accumulation in 2026 US Equities
The Money Flow Index (MFI) is a crucial technical indicator for discerning institutional accumulation in 2026 US equities, offering insights into potential price movements based on money flow volume.

Mastering 3-Month MA Crossover for 2026 US Stock Volatility
The 3-month moving average crossover is a practical technical analysis tool offering robust insights for navigating the anticipated volatility in the 2026 US stock market, guiding strategic investment decisions.

A/D Line Divergence in US Mid-Cap Stocks: 2026 Impact
Understanding A/D Line Divergence in US mid-cap stocks is essential for investors seeking to identify potential trend reversals and informed trading decisions in the dynamic 2026 market.

US Equity Reversals 2026: 14-Day RSI Divergence Insights
This article explores identifying high-probability US equity reversals in 2026 through the 14-day Relative Strength Index (RSI) divergence, offering traders advanced technical analysis insights for informed decision-making.