US Equity Reversals 2026: 14-Day RSI Divergence Insights
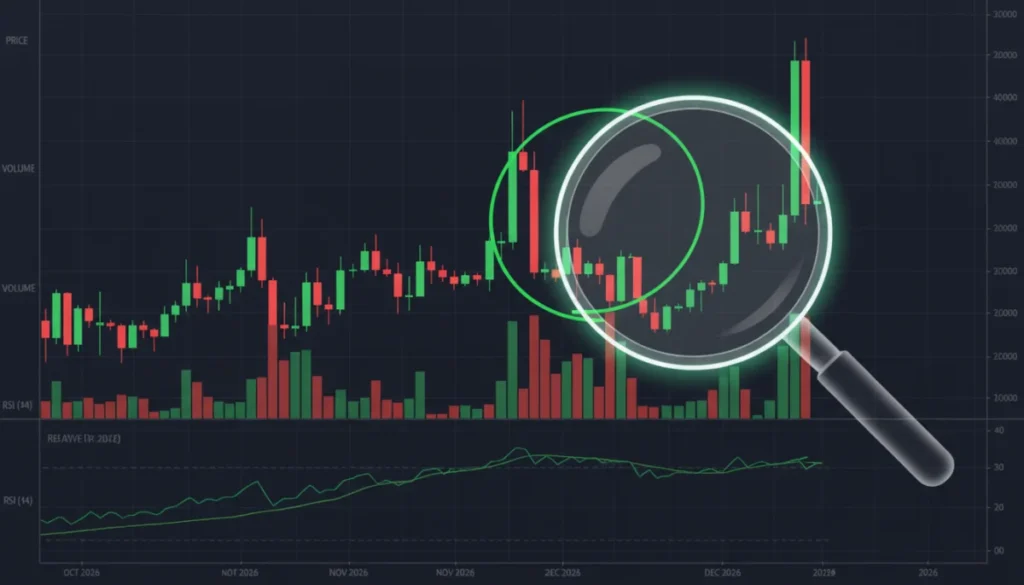
Identifying high-probability US equity reversals in 2026 requires a nuanced understanding of technical indicators like the 14-day Relative Strength Index (RSI) divergence to pinpoint potential market shifts before they become widely apparent.
Are you looking to sharpen your trading edge in the dynamic US equity markets? Understanding how to identify US equity reversals 2026 using advanced technical indicators like the 14-day Relative Strength Index (RSI) divergence could be your key to unlocking significant opportunities. This guide dives deep into this powerful analytical tool, offering insights that can help you anticipate market shifts.
Understanding the 14-Day RSI and Its Core Principles
The Relative Strength Index (RSI) is a momentum oscillator developed by J. Welles Wilder Jr., used to measure the speed and change of price movements. Specifically, the 14-day RSI is one of the most popular settings, calculating the average gains and losses over the past 14 trading periods. This indicator helps traders determine if an asset is overbought or oversold, providing crucial insights into potential price reversals. A high RSI value, typically above 70, suggests an asset might be overbought, indicating a possible downturn. Conversely, an RSI below 30 often signals an oversold condition, hinting at a potential upward reversal.
The calculation behind RSI
The RSI formula involves two main components: average gain and average loss. These averages are smoothed over the 14-day period. The initial calculation uses a simple average, but subsequent calculations employ a wilder’s smoothing method, which assigns more weight to recent data. This smoothing ensures the RSI reacts to current price action while still considering historical trends. Understanding this calculation isn’t strictly necessary for use, but it provides a deeper appreciation for the indicator’s responsiveness.
- Average Gain: Sum of gains over 14 periods divided by 14.
- Average Loss: Sum of losses over 14 periods divided by 14.
- Relative Strength (RS): Average Gain divided by Average Loss.
- RSI: 100 – (100 / (1 + RS)).
The RSI oscillates between 0 and 100. Its primary function is to provide a visual representation of price momentum, helping traders gauge the strength of a trend. When the RSI moves towards its extreme values, it often suggests that the current price trend might be unsustainable and ripe for a reversal. This fundamental understanding forms the bedrock for identifying more complex patterns like divergence, which offers even more predictive power for US equity reversals 2026.
In essence, the 14-day RSI is a versatile tool for gauging market sentiment and identifying potential turning points. Its ability to quantify momentum makes it indispensable for technical analysts looking to anticipate shifts in equity prices. By observing its behavior relative to price, traders can gain an early warning system for impending reversals.
Decoding Divergence: The Key to High-Probability Reversals
Divergence is a critical concept in technical analysis, particularly when using the 14-day RSI. It occurs when the price of an asset moves in one direction, while the RSI indicator moves in the opposite direction. This discrepancy signals a weakening of the current trend and often precedes a significant price reversal. Recognizing divergence effectively can provide a substantial advantage in identifying high-probability US equity reversals 2026.
Bullish divergence explained
Bullish divergence happens when the price of an asset makes a new lower low, but the RSI makes a higher low. This indicates that despite the price falling, the selling momentum is actually weakening. Traders often interpret this as a strong signal that the downtrend is losing steam and a bullish reversal is likely. It suggests that buyers might be stepping in, even if the price hasn’t fully reflected it yet. Identifying this pattern early can position traders favorably for an upward movement.
- Price Action: Lower lows.
- RSI Action: Higher lows.
- Implication: Weakening selling pressure, potential for an uptrend.
Bearish divergence explained
Conversely, bearish divergence occurs when the price of an asset makes a new higher high, but the RSI makes a lower high. This situation suggests that while the price is still rising, the buying momentum is decreasing. It is a warning sign that the uptrend might be losing its strength and a bearish reversal could be imminent. This pattern alerts traders to consider taking profits or preparing for a short position. Understanding both types of divergence is crucial for a comprehensive reversal strategy.
- Price Action: Higher highs.
- RSI Action: Lower highs.
- Implication: Weakening buying pressure, potential for a downtrend.
The power of divergence lies in its ability to provide early warnings. While price action confirms what has already happened, divergence offers a glimpse into what might be coming next, based on the underlying momentum. This predictive quality makes it an invaluable tool for traders aiming to capitalize on significant market turning points. Mastering the identification of these patterns is fundamental for anyone serious about profiting from US equity reversals 2026.
Practical Application: Identifying US Equity Reversals in 2026
Applying the 14-day RSI divergence to real-world trading requires keen observation and a structured approach. For identifying US equity reversals 2026, it’s not enough to simply spot a divergence; one must also consider the broader market context and confirm signals with other indicators. This section outlines a practical framework for utilizing this powerful tool effectively.
When analyzing US equities, begin by scanning charts for clear price trends. Once a trend is established, look for instances where the price makes a new high or low, but the RSI fails to follow suit. For example, if Apple stock (AAPL) is in an uptrend and makes a new high, but its 14-day RSI prints a lower high, that’s a bearish divergence signal. This suggests that the buying pressure behind AAPL is waning, despite the price increase, indicating a potential reversal.
Confirmation with other indicators
Relying solely on RSI divergence can lead to false signals. It is crucial to seek confirmation from other technical indicators. Volume is an excellent companion; a divergence accompanied by decreasing volume in the direction of the trend further strengthens the reversal signal. Additionally, candlestick patterns such as engulfing patterns, hammers, or shooting stars appearing at the point of divergence can provide strong corroboration. Moving averages can also play a role, with price breaking below a key moving average after a bearish divergence offering further confirmation of a downtrend.
- Volume Analysis: Decreasing volume during divergence strengthens the signal.
- Candlestick Patterns: Reversal patterns confirm the shift in sentiment.
- Moving Averages: Price breaking key averages validates the reversal.
Furthermore, considering the time frame is essential. A divergence on a daily chart will typically have a more significant impact than one on a 15-minute chart, though both can be useful for different trading styles. For longer-term US equity reversals 2026, focusing on weekly or even monthly charts can provide more reliable signals, albeit with fewer occurrences. Integrating these various elements creates a robust strategy for identifying high-probability turning points in the market.
The goal is to build a confluence of evidence supporting the reversal. The more confirming signals you have, the higher the probability of a successful trade. This disciplined approach minimizes risk and maximizes potential returns when navigating the complexities of US equity markets in 2026.
Factors Influencing US Equity Reversals Beyond RSI
While the 14-day RSI divergence offers a powerful lens for identifying potential US equity reversals, it’s crucial to acknowledge that market movements are influenced by a multitude of factors. A holistic approach that integrates fundamental analysis, macroeconomic trends, and geopolitical events provides a more complete picture. Relying solely on technical indicators without considering these broader influences can lead to incomplete assessments and missed opportunities.
Macroeconomic indicators and their impact
Key macroeconomic indicators such as interest rate decisions by the Federal Reserve, inflation reports, GDP growth, and employment data can significantly sway market sentiment and trigger widespread equity reversals. For instance, an unexpected hike in interest rates can cool down an overheated market, leading to a broad-based bearish reversal, even if individual stocks are not showing clear technical divergence yet. Keeping a close eye on these economic announcements and their interpretations is vital for anticipating larger market shifts in 2026.
Geopolitical events and market volatility
Geopolitical events, ranging from international trade disputes to regional conflicts, can introduce immense volatility and trigger sudden reversals in equity markets. These events often create uncertainty, leading investors to re-evaluate their risk exposure and potentially pull capital from equities. For example, a sudden escalation in tensions between major global powers could lead to a sharp market downturn, overriding any bullish technical signals present at the time. Staying informed about global affairs is therefore a non-negotiable part of a comprehensive trading strategy for US equity reversals 2026.

Earnings reports and company-specific news also play a significant role. A company reporting weaker-than-expected earnings can experience a sharp downward reversal, regardless of the broader market trend or technical signals. Similarly, groundbreaking product announcements or regulatory approvals can ignite strong upward reversals. Therefore, traders must not only be adept at technical analysis but also well-versed in fundamental research and news interpretation. Combining these layers of analysis significantly enhances the probability of successfully identifying and capitalizing on US equity reversals in 2026.
Ultimately, while the 14-day RSI divergence provides a crucial technical signal, it functions best as part of a multi-faceted analysis strategy. Integrating macroeconomic, geopolitical, and fundamental insights ensures a robust framework for navigating the complex landscape of US equity reversals.
Risk Management and Position Sizing for Reversal Trades
Successfully identifying US equity reversals 2026 using RSI divergence is only half the battle; effective risk management and proper position sizing are equally, if not more, important. Even the most accurate technical signals can result in losses if trades are not managed prudently. A disciplined approach to risk ensures longevity in the market and protects capital from unexpected moves.
Defining stop-loss and take-profit levels
Before entering any trade based on RSI divergence, it is imperative to establish clear stop-loss and take-profit levels. A stop-loss order is designed to limit potential losses by automatically closing a position if the price moves against your prediction beyond a certain point. For a bullish reversal trade, a logical stop-loss might be placed just below the low that formed the bullish divergence. For a bearish reversal, it would be just above the high that formed the bearish divergence. Take-profit levels, on the other hand, define your exit point for realizing gains. These can be set at previous resistance/support levels or based on a predetermined risk-to-reward ratio, such as 1:2 or 1:3.
- Stop-Loss: Essential for limiting downside risk.
- Take-Profit: Crucial for locking in gains and maintaining discipline.
- Risk-to-Reward Ratio: A key determinant of trade viability.
Appropriate position sizing techniques
Position sizing refers to determining the number of shares or contracts to trade, based on your risk tolerance and account size. A common rule of thumb is to risk no more than 1-2% of your total trading capital on any single trade. This means if your stop-loss is hit, you only lose a small fraction of your portfolio, allowing you to absorb multiple small losses without significant damage. To calculate your position size, divide your maximum allowable risk (e.g., 1% of account) by the difference between your entry price and your stop-loss price. This calculation helps prevent emotional trading and ensures that even if several reversal signals fail, your capital remains largely intact for future opportunities.
For example, if you have a $100,000 account and decide to risk 1% per trade, your maximum risk is $1,000. If you enter a trade at $50 and set your stop-loss at $49, your risk per share is $1. You would then buy 1,000 shares ($1,000 / $1). This systematic approach to position sizing is vital for managing capital effectively, especially when dealing with the inherent uncertainties of identifying US equity reversals 2026. Consistent application of these risk management principles is what separates successful traders from those who struggle.
By meticulously planning your stop-loss, take-profit, and position size, you transform each reversal trade into a calculated risk, rather than a speculative gamble. This structured methodology is fundamental for long-term success in the volatile world of US equity markets.
Advanced Strategies: Combining RSI Divergence with Other Tools
While the 14-day RSI divergence is a powerful standalone tool, its effectiveness can be significantly amplified when combined with other advanced technical analysis strategies. This synergy creates a more robust trading system, increasing the probability of identifying high-quality US equity reversals 2026. Integrating multiple indicators provides a confluence of signals, strengthening conviction and improving entry and exit timing.
Utilizing Fibonacci retracement levels
Fibonacci retracement levels are horizontal lines that indicate potential support and resistance areas at key Fibonacci ratios (23.6%, 38.2%, 50%, 61.8%, 78.6%) of a prior price move. When an RSI divergence signals a potential reversal, these Fibonacci levels can act as strategic targets for take-profit orders or as confirmation points. For instance, if a bullish RSI divergence appears at a 61.8% Fibonacci retracement level after a downtrend, it significantly strengthens the probability of an upward reversal from that specific price point. This combination provides both a momentum signal and a price-based confirmation.
Integrating moving average crossovers
Moving average crossovers, such as the 50-day and 200-day simple moving averages (SMAs), are widely used to identify trend changes. When a bullish RSI divergence occurs, and shortly thereafter a shorter-term moving average crosses above a longer-term one (a ‘golden cross’), it provides strong confirmation of a developing uptrend. Conversely, a ‘death cross’ (shorter-term MA crossing below longer-term MA) following a bearish RSI divergence reinforces the likelihood of a sustained downtrend. These crossovers offer a lagging but reliable confirmation of the reversal indicated by the RSI divergence, giving traders more confidence in their positions for US equity reversals 2026.
- Fibonacci Retracements: Identify potential support/resistance and profit targets.
- Moving Average Crossovers: Confirm trend changes and reversal strength.
- Bollinger Bands: Assess volatility and confirm overbought/oversold conditions.
Another effective strategy involves using Bollinger Bands in conjunction with RSI divergence. Bollinger Bands measure market volatility and help identify whether prices are high or low on a relative basis. A price touching the lower Bollinger Band while showing bullish RSI divergence can indicate an oversold condition ready for a bounce. Similarly, a price at the upper band with bearish RSI divergence suggests an overbought state ripe for a pullback. This layered approach to technical analysis provides a more comprehensive view of market dynamics, enabling traders to make more informed decisions when targeting US equity reversals 2026.
By combining RSI divergence with these sophisticated tools, traders can develop a more robust and adaptive strategy. This multi-indicator approach helps filter out false signals and pinpoint the highest-probability trading opportunities, enhancing overall trading performance.
The Psychology of Trading Reversals and Avoiding Pitfalls
Trading US equity reversals, particularly those identified through the 14-day RSI divergence, demands not only technical proficiency but also a strong psychological foundation. The emotional roller coaster of market movements can easily derail even the most well-planned strategies. Understanding and managing the psychological aspects of trading is crucial to avoiding common pitfalls and maintaining discipline.
Overcoming emotional biases
One of the biggest challenges in trading reversals is overcoming emotional biases like fear and greed. Fear can lead traders to exit profitable positions too early or to hesitate entering a valid reversal trade. Greed, conversely, can cause traders to hold onto losing positions hoping for a turnaround or to take excessive risks. When an RSI divergence signals a potential reversal, it’s easy to get swept up in the excitement or apprehension. Maintaining objectivity and sticking to a predefined trading plan, including stop-loss and take-profit levels, is paramount. This detachment from immediate emotional impulses allows for rational decision-making.
Avoiding confirmation bias
Confirmation bias is another significant pitfall, where traders tend to seek out and interpret information in a way that confirms their existing beliefs or expectations. If you are convinced a stock is about to reverse upwards, you might selectively focus on bullish RSI divergences while ignoring contradictory signals. To counteract this, always consider both bullish and bearish scenarios for US equity reversals 2026. Actively look for evidence that might disprove your initial hypothesis. A balanced perspective, coupled with a systematic approach to analyzing all available data, helps in making more accurate trading judgments.
- Emotional Control: Essential for disciplined trading decisions.
- Confirmation Bias: Actively seek opposing viewpoints and data.
- Overtrading: Stick to high-probability setups, avoid constant market engagement.
Furthermore, the temptation to overtrade, especially after a few successful reversal calls, can be detrimental. Not every divergence will lead to a significant reversal, and not every day offers high-probability setups. Patience is a virtue in trading; waiting for clear, confirmed signals, rather than forcing trades, is a hallmark of experienced traders. It’s better to miss a few opportunities than to incur significant losses from poorly conceived or emotionally driven trades. Developing a robust trading journal to track decisions, outcomes, and emotional states can provide valuable insights for continuous improvement in managing the psychological demands of trading US equity reversals 2026.
Ultimately, trading reversals effectively is a blend of technical skill, disciplined risk management, and psychological resilience. Mastering these aspects allows traders to navigate the unpredictable nature of the markets with greater confidence and consistency.
| Key Concept | Brief Description |
|---|---|
| 14-Day RSI | Momentum oscillator measuring speed and change of price movements over 14 periods, indicating overbought/oversold conditions. |
| Bullish Divergence | Price makes lower lows, while RSI makes higher lows, signaling weakening selling pressure and potential uptrend. |
| Bearish Divergence | Price makes higher highs, while RSI makes lower highs, signaling weakening buying pressure and potential downtrend. |
| Risk Management | Crucial for setting stop-loss, take-profit, and position sizing to protect capital during reversal trades. |
Frequently asked questions about US equity reversals
The 14-day RSI divergence occurs when price and the RSI move in opposite directions, signaling a potential trend reversal. For 2026 US equity reversals, it’s crucial because it provides an early warning of weakening momentum, allowing traders to anticipate market shifts before they become obvious to the broader market.
Confirmation is vital. Look for corroborating signals from other indicators like volume (decreasing volume during divergence), candlestick reversal patterns (e.g., engulfing patterns), or moving average crossovers. A confluence of these signals significantly increases the probability of a successful reversal trade, reducing false positives.
Absolutely. Key macroeconomic factors such as interest rate changes by the Federal Reserve, inflation data, GDP reports, and employment figures can trigger significant market-wide reversals. Geopolitical events and company-specific news (like earnings) also play a substantial role, often overriding technical signals.
Common pitfalls include emotional biases (fear and greed), confirmation bias (only seeking confirming data), and overtrading. It’s crucial to stick to a disciplined trading plan, use proper risk management, and avoid chasing every perceived reversal signal to maintain long-term profitability.
Risk management is paramount. Even with high-probability signals, losses are inevitable. Implementing strict stop-loss orders, defining take-profit levels, and using appropriate position sizing (e.g., risking 1-2% of capital per trade) protects your trading capital and ensures longevity in the market, allowing you to absorb losses and capitalize on wins.
Conclusion
Identifying high-probability US equity reversals in 2026 using the 14-day RSI divergence offers a significant edge for informed traders. This powerful technical tool, when understood and applied correctly, provides early signals of weakening trends, enabling proactive trading decisions. However, its true potential is realized when integrated with other technical confirmations, macroeconomic analyses, and robust risk management strategies. By combining diligent chart analysis with a disciplined psychological approach, traders can navigate the complexities of the US equity markets more effectively, capitalizing on turning points and safeguarding their capital. The journey to consistent profitability in reversal trading is one of continuous learning and meticulous application of these insider insights.
