US Market Shifts Q1 2026: Key Candlestick Patterns for Timely Trades
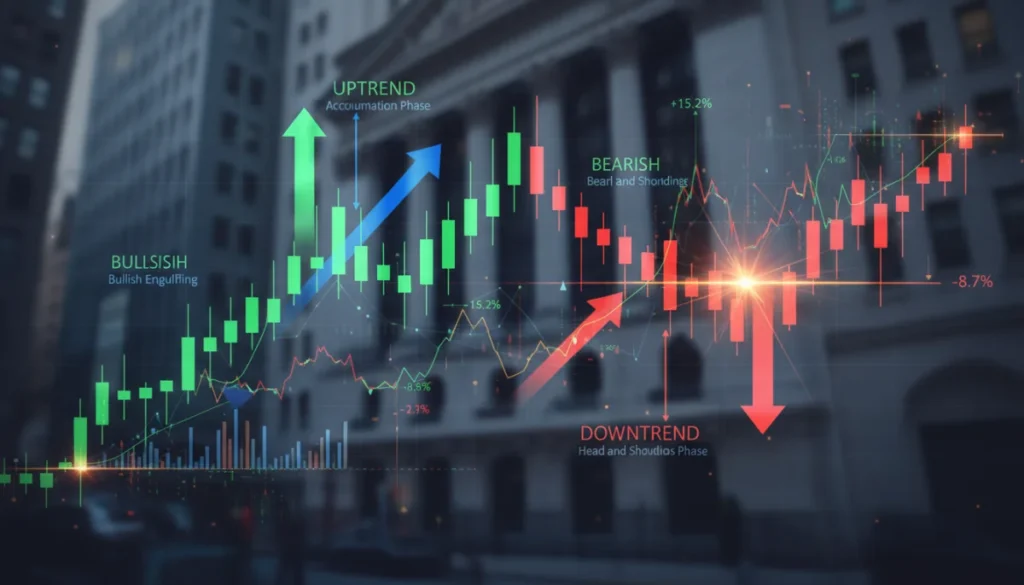
Understanding key candlestick patterns is crucial for identifying significant US market shifts in Q1 2026, enabling traders to make well-timed and strategic investment decisions.
As we approach Q1 2026, understanding candlestick patterns US market indicators becomes paramount for traders seeking to capitalize on market shifts. These visual representations of price action offer invaluable insights into market psychology, helping investors anticipate potential reversals, continuations, and overall sentiment. This guide will delve into five critical candlestick patterns that are expected to play a significant role in signaling US market shifts in the upcoming quarter, providing you with a practical solution for timely trades.
the foundational role of candlestick patterns in market analysis
Candlestick patterns are more than just pretty charts; they are a language spoken by the market itself, offering a nuanced view of price movements that goes beyond simple line graphs. Originating in 18th-century Japan, these patterns have evolved into an indispensable tool for modern technical analysts worldwide, especially in dynamic markets like the US.
Each candlestick tells a story, encapsulating the open, high, low, and close prices for a specific period. The body of the candle reveals whether the closing price was higher or lower than the opening price, while the wicks (or shadows) extend to show the highest and lowest prices traded during that period. Interpreting these stories collectively allows traders to gauge buying and selling pressure, momentum, and potential shifts in market direction.
decoding market sentiment with visual cues
The beauty of candlestick patterns lies in their ability to quickly convey market sentiment. A long white (or green) body indicates strong buying pressure, suggesting bullish sentiment, while a long black (or red) body points to strong selling pressure and bearish sentiment. Short bodies, regardless of color, often signal indecision or consolidation.
- Body Color and Size: Reflects the strength of buying or selling pressure.
- Wick Length: Indicates the price extremes and potential rejection levels.
- Pattern Formation: Combines multiple candlesticks to form predictive signals.
By learning to read these visual cues, traders can develop a deeper understanding of market dynamics, moving beyond simple price points to grasp the underlying forces at play. This foundational knowledge is crucial for anyone looking to navigate the complexities of the US market in Q1 2026 with confidence.
the bullish engulfing pattern: signaling uptrends
The bullish engulfing pattern is a powerful reversal signal often observed at the bottom of a downtrend, indicating a potential shift towards upward momentum. This two-candlestick pattern is characterized by a small bearish candlestick being completely engulfed by a larger bullish candlestick that follows it.
For this pattern to be considered valid, the second candlestick’s body must fully cover the body of the first. The larger the engulfing candlestick, the stronger the potential reversal signal. It signifies that buyers have overcome sellers, pushing prices higher and potentially initiating a new uptrend. In Q1 2026, identifying these patterns could be crucial for early entry into promising US stocks or indices.
recognizing and confirming the pattern
When spotting a bullish engulfing pattern, it’s essential to look for specific characteristics. The first candle should be bearish (red or black), indicating the prevailing downtrend. The second candle must be bullish (green or white) and its opening price should be lower than the previous day’s close, while its closing price should be higher than the previous day’s open.
- Prior Downtrend: The pattern must appear after a clear downtrend.
- Engulfing Body: The bullish candle’s body fully engulfs the bearish candle’s body.
- Volume Confirmation: Higher volume on the engulfing candle strengthens the signal.
Confirmation from other technical indicators, such as increased trading volume on the engulfing day or a subsequent strong upward move, can further validate the signal. Traders should exercise patience and wait for confirmation before making a trade, as false signals can occur. This pattern provides a clear visual representation of a shift in power from sellers to buyers, making it a reliable indicator for potential bullish reversals in the US market.
the bearish engulfing pattern: anticipating downtrends
Conversely, the bearish engulfing pattern is a strong reversal signal that often appears at the top of an uptrend, foreshadowing a potential shift towards downward momentum. This pattern involves a small bullish candlestick being completely engulfed by a larger bearish candlestick that closes below the previous candle’s open.
This pattern indicates that sellers have overwhelmed buyers, pushing prices lower and potentially initiating a new downtrend. For traders in Q1 2026, recognizing this pattern can be vital for exiting long positions or initiating short trades in the US market, thus protecting capital and potentially profiting from declines.
key features and trading implications
A valid bearish engulfing pattern requires the first candle to be bullish (green or white), indicating the prevailing uptrend. The second candle must be bearish (red or black) and its opening price should be higher than the previous day’s close, while its closing price should be lower than the previous day’s open. The larger the bearish candle, the more significant the selling pressure.
- Prior Uptrend: The pattern must occur after an established uptrend.
- Engulfing Body: The bearish candle’s body completely covers the bullish candle’s body.
- Confirmation: Look for increased volume and subsequent price declines.
As with its bullish counterpart, confirmation is key. A surge in trading volume during the formation of the bearish engulfing candle, combined with a subsequent downward move, reinforces the signal. This pattern serves as a critical warning sign for traders, suggesting that the market’s bullish sentiment is waning and a bearish reversal is likely approaching. Understanding its implications is essential for navigating potential downturns in the US market.
the hammer and hanging man: reversal at extremes
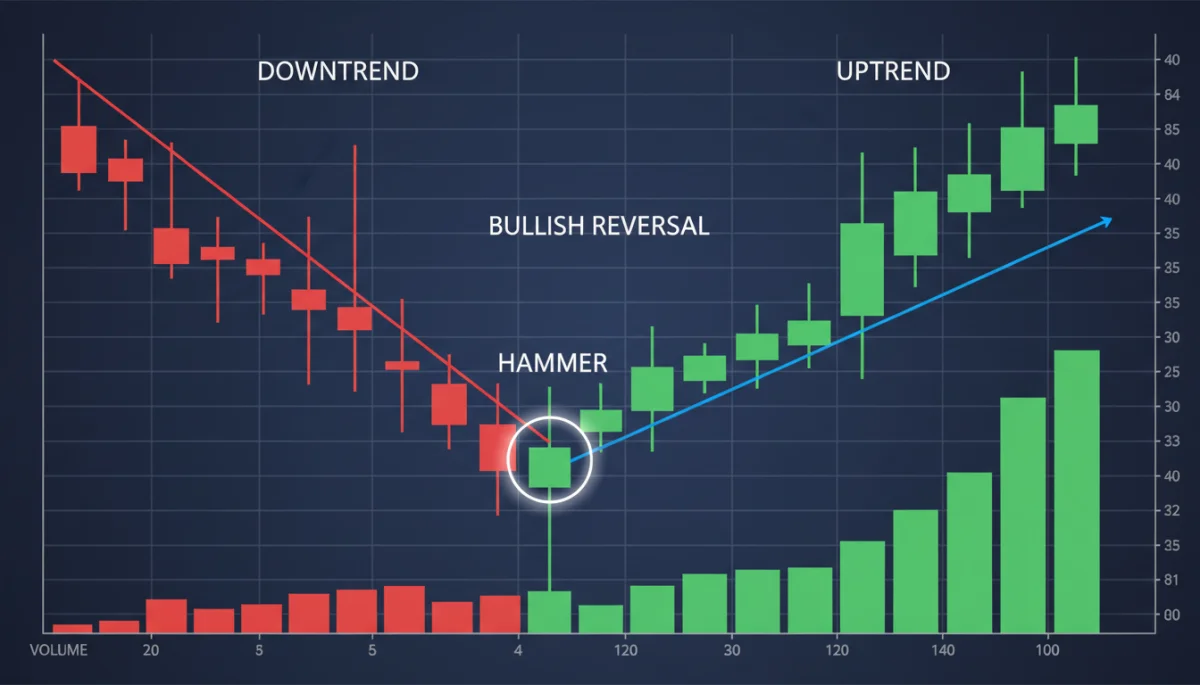
The Hammer and Hanging Man are single-candlestick patterns that signal potential trend reversals, typically found at the extremes of a trend. A Hammer forms during a downtrend and suggests a potential bullish reversal, while a Hanging Man forms during an uptrend and indicates a potential bearish reversal. Both patterns have a small body near the top of the trading range and a long lower wick, at least twice the length of the body.
The color of the body is less important than the pattern’s formation and its location within the trend. A Hammer shows that despite initial selling pressure, buyers stepped in to push prices back up, indicating the downtrend might be losing steam. Conversely, a Hanging Man suggests that even after buyers pushed prices up, selling pressure emerged, hinting at a weakening uptrend. These patterns are particularly relevant for identifying quick shifts in sentiment in the US market during Q1 2026.
distinguishing between the two and their implications
The primary difference between a Hammer and a Hanging Man is their preceding trend. A Hammer emerges after a clear downtrend, signaling that bears might be exhausted and bulls are gaining control. Its long lower wick indicates that sellers pushed prices down, but buyers aggressively bought back, leading to a close near the open or higher.
On the other hand, a Hanging Man appears after an uptrend, suggesting that despite continued bullish momentum, significant selling pressure emerged during the day, threatening the uptrend’s sustainability. Its long lower wick indicates that while bulls managed to push prices up, selling pressure was strong enough to pull prices back down significantly before closing.
- Hammer (Bullish Reversal): Found in downtrends, indicates buying pressure after initial sell-off.
- Hanging Man (Bearish Reversal): Found in uptrends, indicates selling pressure after initial rally.
- Confirmation: Always wait for subsequent candles to confirm the reversal signal.
Both patterns require confirmation from subsequent price action. For a Hammer, a strong bullish candle following it confirms the reversal. For a Hanging Man, a bearish candle closing below the Hanging Man’s body would confirm the bearish reversal. These patterns are relatively simple but offer powerful insights into market turning points, especially when combined with other indicators for US market analysis.
the morning star and evening star: comprehensive reversal signals
The Morning Star and Evening Star are three-candlestick patterns that offer more robust reversal signals than single or two-candlestick patterns. A Morning Star is a bullish reversal pattern found at the bottom of a downtrend, while an Evening Star is a bearish reversal pattern found at the top of an uptrend. These patterns represent significant shifts in market sentiment over three trading periods.
A Morning Star pattern begins with a long bearish candle, followed by a small-bodied candle (often a Doji or spinning top) that gaps down. The third candle is a long bullish candle that gaps up and closes well into the body of the first bearish candle. This sequence illustrates a clear transition from bearish dominance to indecision, and finally to bullish control. For Q1 2026, observing these comprehensive patterns can provide high-conviction trading opportunities in the US market.
structure and strategic interpretation
The Evening Star pattern is the bearish equivalent, beginning with a long bullish candle, followed by a small-bodied candle that gaps up. The third candle is a long bearish candle that gaps down and closes well into the body of the first bullish candle. This sequence signifies a shift from bullish dominance to indecision, and then to strong bearish control.
- Morning Star (Bullish): Downtrend, large bearish, small indecisive, large bullish.
- Evening Star (Bearish): Uptrend, large bullish, small indecisive, large bearish.
- Volume: Increased volume on the third candle enhances reliability.
The small-bodied middle candle in both patterns represents a period of market indecision or equilibrium between buyers and sellers. The subsequent large candle, moving in the opposite direction of the initial trend, confirms the reversal. These patterns are particularly valuable due to their multi-candlestick structure, which provides stronger evidence of a trend change compared to simpler patterns. Traders should pay close attention to these formations for significant trend reversals in the US market.
doji patterns: indicating market indecision and potential shifts
Doji patterns are single candlesticks where the opening and closing prices are virtually the same, forming a cross or plus sign shape. The length of the wicks can vary significantly, but the central theme remains market indecision. A Doji suggests that neither buyers nor sellers could gain control during the trading period, leading to a stalemate.
While a Doji itself is a sign of indecision, its significance increases dramatically when it appears after a prolonged trend. After an uptrend, a Doji might signal that buying pressure is waning and a reversal could be imminent. Similarly, after a downtrend, a Doji could suggest that selling pressure is exhausting itself, paving the way for a bullish reversal. In Q1 2026, monitoring Doji patterns within established trends can offer early warnings of potential US market shifts.
types of doji and their market implications
There are several variations of Doji patterns, each with slightly different implications for market analysis:
- Standard Doji: Indicates general indecision; often a sign of consolidation or potential reversal.
- Long-Legged Doji: Features long upper and lower wicks, showing significant price volatility but ultimately no clear direction.
- Dragonfly Doji: Has a long lower wick and no upper wick, appearing at the bottom of a downtrend and suggesting a bullish reversal.
- Gravestone Doji: Has a long upper wick and no lower wick, appearing at the top of an uptrend and suggesting a bearish reversal.
The context in which a Doji appears is critical for its interpretation. A Doji in a choppy, sideways market might be less significant than one found at a crucial support or resistance level after a strong trend. Traders should combine Doji patterns with other technical indicators, such as Bollinger Bands or RSI, to confirm potential reversals. These patterns serve as subtle yet powerful indicators of shifting market dynamics, providing valuable insights for proactive trading strategies in the US market.
implementing candlestick patterns for timely trades in q1 2026
Successfully integrating candlestick patterns into a trading strategy for Q1 2026 requires more than just recognizing the patterns; it demands a disciplined approach to confirmation, risk management, and continuous learning. No single pattern guarantees a specific outcome, but when combined with other forms of technical analysis, their predictive power significantly increases.
For instance, identifying a bullish engulfing pattern near a strong support level, coupled with increasing volume and a bullish divergence on the Relative Strength Index (RSI), presents a far more compelling trade setup than the pattern in isolation. This layered approach helps filter out false signals and enhances the probability of successful trades, which is crucial in the volatile US market landscape.
developing a robust trading strategy
A practical solution for timely trades involves a multi-faceted strategy. First, traders should establish their preferred timeframes for analysis, whether it’s daily, weekly, or intraday charts. Next, they should focus on identifying key support and resistance levels, as these are often where reversals and continuations are most likely to occur.
- Multi-Timeframe Analysis: Confirm patterns across different timeframes for stronger signals.
- Support and Resistance: Identify key price levels for entry and exit points.
- Risk Management: Always define stop-loss orders to limit potential losses.
- Continuous Learning: Market dynamics evolve, so stay updated on new patterns and indicators.
Finally, always incorporate strict risk management principles, setting stop-loss orders to protect capital and defining clear profit targets. The US market in Q1 2026 is expected to present numerous opportunities, but only those who approach trading with a well-defined strategy and a keen eye for these key candlestick patterns will truly be able to make timely and profitable trades. Continuous education and adaptation to market conditions are also vital for long-term success.
| Key Pattern | Market Implication |
|---|---|
| Bullish Engulfing | Strong bullish reversal from a downtrend. |
| Bearish Engulfing | Strong bearish reversal from an uptrend. |
| Hammer / Hanging Man | Potential bullish (Hammer) or bearish (Hanging Man) reversal at trend extremes. |
| Morning / Evening Star | Comprehensive bullish (Morning) or bearish (Evening) reversal signals. |
frequently asked questions about candlestick patterns
The most reliable patterns include the Bullish and Bearish Engulfing, Hammer, Hanging Man, Morning Star, and Evening Star. These patterns, especially when confirmed by volume and other indicators, offer strong signals for potential trend reversals in the US market.
Confirmation is crucial. Look for increased trading volume accompanying the pattern, subsequent price action in the direction of the indicated reversal, and alignment with other technical indicators like RSI, MACD, or support/resistance levels. Never rely on a single signal.
While generally effective, their reliability can vary. They are most potent in trending markets (uptrends or downtrends) for identifying reversals. In sideways or highly volatile, choppy markets, their signals can be less reliable and require more stringent confirmation.
A Doji indicates market indecision, where opening and closing prices are nearly identical. When appearing after a significant trend, it suggests a potential exhaustion of that trend and an impending reversal, as neither buyers nor sellers could dominate.
Use them as part of a broader strategy. Identify patterns at key support/resistance levels, confirm with volume and other indicators, and always implement strict risk management with stop-loss orders. Practice on demo accounts before live trading.
conclusion
The ability to interpret candlestick patterns is an indispensable skill for any trader or investor aiming to navigate the complexities of the US market, especially as we look towards Q1 2026. The five key patterns discussed—Bullish Engulfing, Bearish Engulfing, Hammer, Hanging Man, Morning Star, and Evening Star, along with the Doji—provide powerful visual cues for anticipating market shifts. By diligently applying these patterns in conjunction with other technical analysis tools and robust risk management, traders can significantly enhance their decision-making process, leading to more timely and potentially profitable trades. Continuous learning and adaptation to evolving market conditions will be crucial for sustained success in the dynamic financial landscape.
