Keltner Channels: 2026 Strategy for US Commodity Breakouts
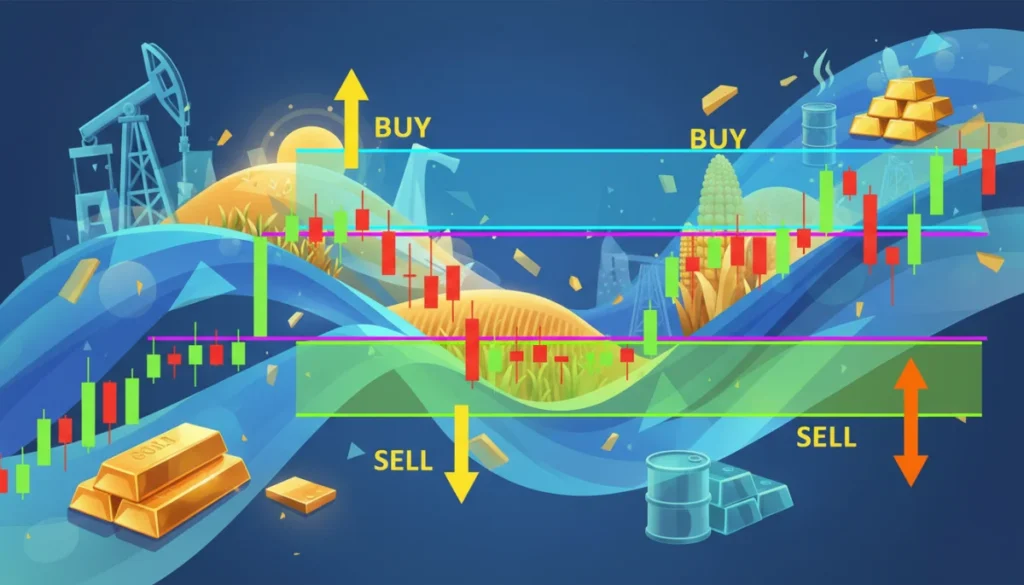
A 2026 strategy leveraging Keltner Channels can empower traders to pinpoint and profit from five distinct breakout scenarios in volatile US commodity markets, enhancing predictive accuracy.
In the dynamic world of commodity trading, identifying significant market movements before they fully unfold is the holy grail for many investors. The year 2026 promises continued volatility and opportunity in US commodities, making advanced technical analysis tools more crucial than ever. This article delves into a sophisticated approach using Keltner Channels: A 2026 Strategy for Detecting 5 Key Breakouts in US Commodities. We will explore how this powerful indicator can be leveraged to forecast and capitalize on critical price excursions, offering a strategic edge in an ever-evolving market landscape.
Understanding Keltner Channels: The Foundation for Breakout Detection
Keltner Channels are a volatility-based technical indicator designed to identify trend direction and provide trade signals. Unlike Bollinger Bands, which use standard deviation, Keltner Channels utilize the Average True Range (ATR) to set their bands, often resulting in smoother channels that are less prone to false signals during periods of low volatility. This distinction is crucial for effective breakout detection in commodities, where price movements can be sharp and unpredictable.
The core components of Keltner Channels include a middle line, typically an Exponential Moving Average (EMA), and upper and lower bands positioned a multiple of the ATR away from the EMA. The choice of EMA period and ATR multiplier significantly impacts the channel’s sensitivity. For 2026 US commodity markets, fine-tuning these parameters becomes essential to capture relevant price action without being overwhelmed by noise.
Key Components and Calculation
Understanding how Keltner Channels are constructed is fundamental to applying them effectively. The standard calculation involves a 20-period EMA for the middle line, and upper/lower bands set at 2x ATR above and below the EMA. However, these values are adjustable, and traders often experiment to find optimal settings for different commodities and timeframes.
- Middle Line: Usually a 20-period Exponential Moving Average (EMA) of the price.
- Upper Band: Middle Line + (ATR multiplier * Average True Range).
- Lower Band: Middle Line – (ATR multiplier * Average True Range).
- Average True Range (ATR): A measure of market volatility, typically calculated over 10 or 20 periods.
By encompassing price action within these bands, Keltner Channels offer a visual representation of a commodity’s typical price range. When prices move outside these bands, it often signals a significant increase in momentum and potential for a sustained breakout. This initial understanding forms the bedrock of our 2026 breakout strategy.
The 2026 Strategy: Setting Up Keltner Channels for US Commodities
Adapting Keltner Channels for the specific nuances of US commodity markets in 2026 requires a tailored approach. Given the anticipated market dynamics, including geopolitical shifts, supply chain optimizations, and evolving demand patterns, standard settings might not be sufficient. Our strategy emphasizes slightly modified parameters to enhance signal clarity and reduce whipsaws.
For most liquid US commodities such as Crude Oil, Natural Gas, Gold, Corn, and Soybeans, an 18-period EMA and a 2.2x ATR multiplier often provide a balanced view. This slightly shorter EMA reacts quicker to recent price changes, while the slightly wider ATR multiplier filters out minor volatility spikes, focusing on more robust breakout attempts. Timeframe selection is also paramount; for swing trading, daily charts are preferred, while intraday traders might use hourly or 4-hour charts.
Optimizing Parameters for Volatile Markets
The inherent volatility of commodities demands careful consideration when setting up Keltner Channels. A channel that is too narrow will generate excessive false signals, while one that is too wide will miss valid opportunities. The 2.2x ATR multiplier, slightly higher than the conventional 2.0x, provides a bit more room for typical price fluctuations, ensuring that only genuine momentum-driven breakouts are flagged.
- EMA Period: 18 periods (instead of 20) for quicker responsiveness to current market sentiment.
- ATR Multiplier: 2.2x (instead of 2.0x) to filter out minor price excursions and focus on stronger moves.
- Timeframes: Daily charts for swing trading, 4-hour or hourly for active day trading.
- Commodity Focus: Crude Oil, Natural Gas, Gold, Silver, Corn, Soybeans, Wheat.
This optimized setup aims to capture significant deviations from the mean price, which are characteristic of strong breakout moves in commodity markets. By calibrating the channels to 2026 market conditions, traders can gain a clearer perspective on when a commodity is truly breaking out, rather than just experiencing temporary price swings.
Detecting Breakout Type 1: Sustained Momentum Breakouts
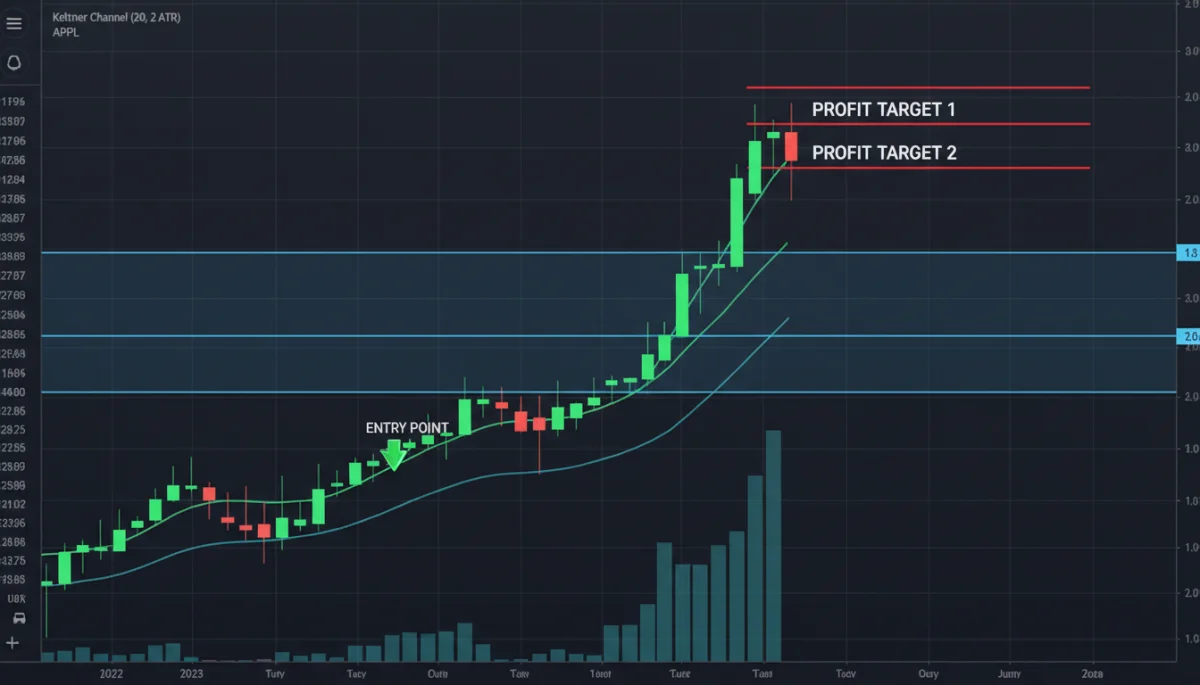
The first key breakout type identifiable with Keltner Channels is the sustained momentum breakout. This occurs when the price decisively closes outside either the upper or lower Keltner Channel band, and crucially, continues to trade beyond that band for several subsequent periods. This indicates strong directional conviction from market participants and a high probability of a continued trend.
In 2026 US commodities, such breakouts might be triggered by major economic reports, unexpected supply disruptions, or significant shifts in global demand. For instance, a strong close above the upper band in crude oil, followed by another close above it, suggests significant bullish pressure. Traders should look for increased volume accompanying these moves as confirmation, reinforcing the strength of the breakout.
Confirming Sustained Momentum with Volume
While Keltner Channels provide the visual cue, volume acts as a critical secondary confirmation. A breakout on low volume is often suspect and may quickly reverse. Conversely, a breakout accompanied by significantly higher-than-average volume suggests broad market participation and conviction behind the move.
- Entry Signal: Price closes above the upper band (for bullish) or below the lower band (for bearish).
- Confirmation: Subsequent price action remains outside the band for 1-2 periods.
- Secondary Confirmation: Significant increase in trading volume during the breakout.
- Exit Strategy: Consider exiting if price re-enters the channel and closes within it, or if momentum indicators diverge.
This type of breakout is particularly effective in trending markets, offering opportunities to join established movements early. The sustained nature of the breakout provides a clearer entry point and allows for more confident position sizing, as the market is clearly signaling its intent.
Detecting Breakout Type 2: Volatility Expansion Breakouts
Volatility expansion breakouts are characterized by a sudden and sharp increase in price movement, often after a period of consolidation or low volatility. Keltner Channels are particularly adept at highlighting these shifts because their bands are based on ATR. When volatility expands, the ATR increases, causing the Keltner Channels to widen significantly, and price often breaks out of the existing, narrower channel.
This type of breakout in US commodities can be seen as a market waking up from a slumber, often preceding major price trends. For example, after a period of tight price range in gold, a sudden move that pushes the price beyond the widening Keltner Channels indicates a strong surge in directional pressure. This often happens around key news events or when fundamental shifts begin to be priced in by the market.
Identifying Pre-Breakout Consolidation
Before a volatility expansion breakout, commodities often exhibit a period of reduced volatility, where the Keltner Channels contract and narrow. This contraction acts as a coiled spring, building energy for the eventual expansion.
- Pre-Breakout Sign: Keltner Channels narrow significantly, indicating low volatility.
- Breakout Trigger: Price suddenly moves and closes outside the contracted channels.
- Confirmation: The channels themselves start to widen rapidly, reflecting increased ATR.
- Trading Implication: These breakouts often lead to strong, rapid moves, requiring quick execution.
Trading these breakouts involves identifying the contraction phase, anticipating the expansion, and then acting swiftly once the price pierces the channel boundaries with conviction. The widening of the channels post-breakout serves as an excellent visual confirmation that volatility has indeed expanded, supporting the validity of the move.
Detecting Breakout Type 3: False Breakout Reversals
Not all breakouts lead to sustained trends; some are false signals designed to trap traders. However, Keltner Channels can be effectively used to identify these false breakouts and potentially trade the subsequent reversal. A false breakout occurs when the price temporarily moves outside the Keltner Channel, only to quickly reverse and re-enter the channel, often with renewed momentum in the opposite direction.
In US commodities, these scenarios are common, especially around psychological price levels or during periods of market indecision. For instance, if crude oil briefly pushes above the upper Keltner Channel, but then swiftly retreats and closes back inside, it could signal exhaustion of the bullish move and a potential reversal downwards. This requires keen observation and often benefits from combining Keltner Channels with other reversal indicators.
Strategies for Trading False Breakouts
Trading false breakouts requires a counter-trend mindset and careful risk management. The key is to wait for the price to re-enter the channel convincingly before initiating a trade in the opposite direction of the initial ‘breakout’.
- Initial Signal: Price closes outside a Keltner Channel band.
- False Breakout Confirmation: Price quickly re-enters the channel and closes within it, often with an opposing candlestick pattern (e.g., a bearish engulfing after an upward false breakout).
- Entry Point: Trade in the direction opposite to the initial false breakout once the price confirms re-entry into the channel.
- Risk Management: Strict stop-loss orders are crucial, placed just beyond the peak/trough of the false breakout.
Identifying and acting on false breakout reversals can be a powerful strategy, allowing traders to profit from market traps. It highlights the importance of not just observing price action relative to the channels, but also considering the immediate follow-through or lack thereof.
Detecting Breakout Type 4: Trend Continuation Breakouts
Trend continuation breakouts occur within an established trend, where the price consolidates briefly before breaking out to continue in the original direction. Keltner Channels can help identify these consolidation phases and pinpoint the exact moment the trend resumes. During consolidation, the price might oscillate within the Keltner Channels, or even briefly touch the opposite band, before momentum builds again.
For example, in an uptrend for natural gas, the price might pull back towards the middle Keltner Channel line or even the lower band before finding support and breaking out again above the upper band. This signals that the underlying trend remains strong and the pullback was merely a temporary pause. These setups offer excellent opportunities to add to existing positions or enter new ones with the trend.
Using Keltner Channels with Trend Indicators
Combining Keltner Channels with a trend-following indicator, such as a longer-period moving average or the ADX, can enhance the identification of trend continuation breakouts. This ensures that the breakout is indeed aligning with the broader market direction.
- Context: Established uptrend or downtrend.
- Consolidation: Price pulls back towards the middle line or opposite band of the Keltner Channel.
- Breakout Signal: Price then breaks out of the Keltner Channel in the direction of the main trend.
- Confirmation: Trend indicators (e.g., MACD, RSI) confirm renewed momentum in the trend direction.
These continuation patterns are often less risky than initial breakouts, as the market has already demonstrated a clear directional bias. Keltner Channels help to precisely time the re-entry into the trend, maximizing potential gains while minimizing exposure during consolidation phases.
Detecting Breakout Type 5: Exhaustion Breakouts and Reversals
Exhaustion breakouts are a more advanced application of Keltner Channels, signaling the potential end of a prolonged trend and the likelihood of a reversal. This occurs when the price makes an aggressive move outside the Keltner Channel, often with high volume, but fails to maintain that momentum. Instead, it quickly stalls or reverses, suggesting that the last surge was an “exhaustion gap” or “blow-off top/bottom.”
In US commodities, particularly after extended rallies or declines, an exhaustion breakout might look like a final, desperate push outside the Keltner Channel. For instance, after a long bullish run in corn, a sharp spike above the upper band that immediately reverses back into the channel, perhaps forming a shooting star or bearish engulfing pattern, could indicate that buyers are exhausted and sellers are taking control.
Identifying Exhaustion with Divergence
Exhaustion breakouts are often best confirmed by divergence with momentum oscillators like the Relative Strength Index (RSI) or MACD. If price makes a new high outside the Keltner Channel, but the oscillator makes a lower high, it’s a strong sign of underlying weakness.
- Initial Signal: Price makes a significant move outside the Keltner Channel after a prolonged trend.
- Confirmation: Price fails to maintain the breakout, quickly re-entering the channel, often with a reversal candlestick.
- Secondary Confirmation: Momentum indicator divergence (e.g., bearish divergence at an upper band breakout).
- Trading Strategy: Look for reversal entries once the price confirms re-entry and momentum shifts.
This fifth type of breakout requires a nuanced understanding of market psychology and the ability to differentiate between a true breakout and a final, desperate push. When successfully identified, exhaustion breakouts can offer highly profitable counter-trend trading opportunities, capturing major reversals in commodity prices.
| Breakout Type | Brief Description |
|---|---|
| Sustained Momentum | Price decisively closes and remains outside Keltner Channel, often with high volume. |
| Volatility Expansion | Price breaks out from narrowing Keltner Channels as volatility rapidly increases. |
| False Breakout Reversal | Price briefly exits, then swiftly re-enters the channel, signaling a reversal. |
| Exhaustion Breakout | Aggressive move outside channel, quickly stalls/reverses, often with divergence. |
Frequently Asked Questions About Keltner Channels in 2026
For 2026 US commodity markets, an 18-period EMA for the middle line and a 2.2x ATR multiplier for the bands are often recommended. These settings provide a balance between responsiveness to current price action and filtering out minor volatility, helping to identify more significant breakouts.
Keltner Channels use Average True Range (ATR) to measure volatility, making them smoother and less prone to false signals during low volatility. Bollinger Bands use standard deviation, which can cause them to widen and narrow more dramatically, sometimes leading to more whipsaws in commodity markets.
While Keltner Channels are versatile, their effectiveness can vary slightly across breakout types. They are particularly strong for volatility expansion and sustained momentum breakouts. False breakouts and exhaustion breakouts often require additional confirmation from other indicators or candlestick patterns for higher accuracy.
Keltner Channels are generally applicable across various US commodities, but parameter adjustments are crucial. They work well on daily and 4-hour charts for swing trading. For very short intraday timeframes, they can still be used, but false signals may increase, necessitating tighter risk management and additional filters.
Conclusion
The strategic application of Keltner Channels offers a robust framework for detecting five distinct types of breakouts in the challenging 2026 US commodity markets. By understanding the nuances of sustained momentum, volatility expansion, false breakout reversals, trend continuation, and exhaustion breakouts, traders can significantly enhance their ability to identify high-probability trading opportunities. The optimized settings and complementary use of other indicators discussed herein provide a comprehensive approach to navigating commodity volatility. As market dynamics continue to evolve, mastering tools like Keltner Channels will remain indispensable for those seeking a competitive edge in US commodity trading.
