Renko Charts: Clearer US Market Trends for 2026
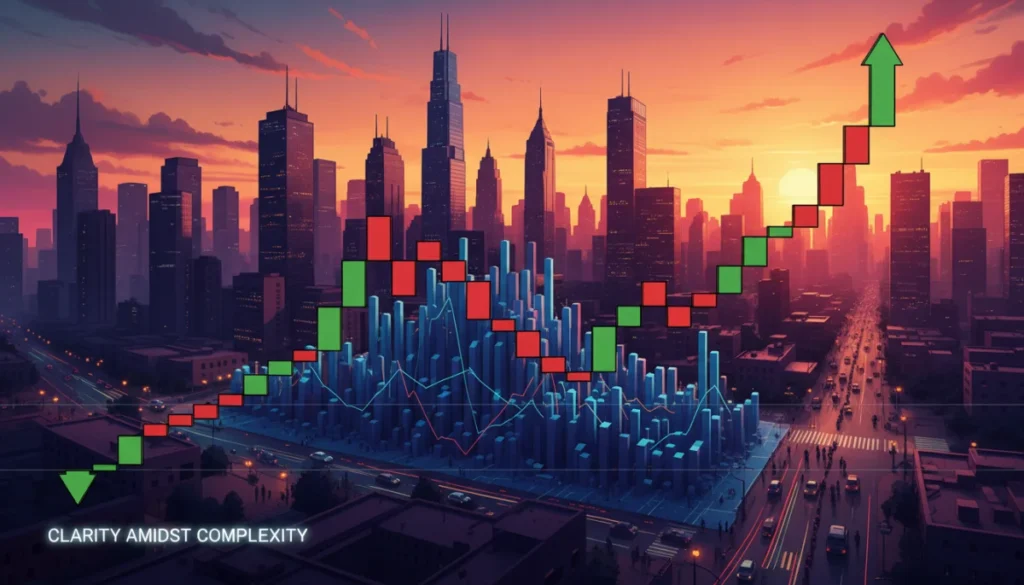
Renko Charts are a powerful technical analysis tool that simplifies US market data, enhancing trend identification by eliminating time and minor price fluctuations.
In the dynamic world of financial markets, discerning genuine trends amidst the constant ebb and flow of price action can be a formidable challenge. This is especially true for the US market, known for its volatility and rapid movements. Enter Renko Charts: Simplifying US Market Noise for 20% Clearer Trend Identification in 2026. These unique charts offer a distinct advantage by focusing purely on price movement, helping traders and investors cut through the clutter and gain a more precise understanding of market direction.
Understanding the Fundamentals of Renko Charts
Renko charts, derived from the Japanese word ‘renga’ meaning brick, provide a visual representation of price action that filters out minor price movements and time, focusing instead on significant trend shifts. Unlike traditional candlestick or bar charts that plot price against time, Renko charts only draw a new ‘brick’ when price moves a specified amount, either up or down. This unique construction helps to simplify market data, making trends much easier to identify and follow.
The core concept behind Renko charts is their dependency on a predefined ‘brick size.’ This brick size is the minimum price movement required to draw a new brick. For instance, if the brick size is $1, a new brick will only appear after the price moves $1 up or down from the close of the previous brick. This mechanism effectively removes noise and consolidates price action into clear, discernible trends, which is particularly beneficial when analyzing the often-noisy US market.
The beauty of Renko charts lies in their ability to present a clean, unambiguous view of price trends. When the market is moving consistently in one direction, Renko charts display a series of bricks of the same color, indicating a strong trend. A change in brick color signals a potential reversal or a shift in market sentiment. This visual clarity can be a game-changer for traders seeking to identify and capitalize on sustained market movements.
Setting the Optimal Brick Size
- Volatility-based brick size: Using indicators like Average True Range (ATR) can help set a dynamic brick size that adapts to current market volatility.
- Percentage-based brick size: A fixed percentage of the asset’s price can ensure consistency across different price levels.
- Fixed-value brick size: A specific dollar amount, chosen based on historical price action or support/resistance levels, can also be effective.
The optimal brick size often depends on the trader’s strategy and the specific asset being analyzed. Experimentation and backtesting are key to finding the most suitable setting for your trading approach. A well-chosen brick size ensures that the Renko chart effectively simplifies the market without oversimplifying or delaying crucial signals.
In conclusion, understanding the fundamental mechanics of Renko charts, particularly the role of brick size, is essential for leveraging their power in analyzing the US market. By stripping away time and minor price movements, Renko charts offer a simplified yet profound perspective on market trends, paving the way for more informed trading decisions.
Filtering Market Noise: A Core Renko Advantage
One of the most compelling advantages of Renko charts, especially within the dynamic US market, is their exceptional ability to filter out market noise. Traditional charts, which plot every price fluctuation over time, often present a cluttered view, making it difficult to differentiate between genuine trend movements and random, insignificant price variations. Renko charts address this by only recording price changes that meet a predetermined threshold, effectively smoothing out the data.
This noise reduction is particularly beneficial in volatile markets where minor price swings can create false signals and induce premature entries or exits. By eliminating these distractions, Renko charts allow traders to focus on the underlying trend, providing a calmer and more objective view of market direction. This clarity can significantly reduce emotional trading, leading to more disciplined and strategic decision-making.
Consider the daily price action of a typical US stock. Without Renko charts, a trader might see numerous small up and down movements, making it challenging to determine if the stock is genuinely trending or just consolidating. With Renko charts, these minor fluctuations are ignored, and only significant price movements are depicted as new bricks. This creates a visually clean chart where trends are easily identifiable by a continuous series of bricks of the same color.
Impact on Trend Identification
- Reduced false signals: Fewer whipsaws and minor reversals are displayed, leading to more reliable trend signals.
- Enhanced trend continuity: Trends appear smoother and more sustained, making it easier to hold positions through minor corrections.
- Improved visual clarity: The clean, brick-like structure is less overwhelming and easier to interpret, even for novice traders.
This enhanced clarity allows traders to identify trend beginnings, continuations, and potential reversals with greater confidence. The ability to filter out the daily market chatter and focus on the significant price movements is a powerful tool for anyone looking to navigate the complexities of the US market more effectively. It helps in making decisions based on solid price action rather than transient fluctuations.
In essence, Renko charts provide a purified view of price, stripping away the noise that often obscures true market direction. This fundamental advantage makes them an invaluable tool for anyone seeking to identify and capitalize on trends in the bustling US financial landscape.
Strategic Trend Identification with Renko Charts
Identifying trends is the cornerstone of many successful trading strategies, and Renko charts excel in this area by presenting trends in a highly digestible format. Their brick-based construction inherently highlights sustained price movements, making it easier for traders to spot the beginning, middle, and end of a trend. This visual simplicity allows for quicker and more confident strategic decisions, particularly in the fast-paced US market.
When a series of bricks of the same color forms, it signals a clear trend. For example, a succession of green bricks indicates a strong uptrend, while a run of red bricks points to a robust downtrend. Reversals are signaled by a change in brick color, often after a series of bricks in the opposite direction. This straightforward visual cue is a significant advantage over other charting methods where trend changes can be more ambiguous and open to interpretation.
Moreover, Renko charts help in identifying the strength of a trend. A long series of bricks in one direction without any opposing bricks indicates a powerful, uninterrupted move. Conversely, a trend characterized by alternating bricks of different colors, even if the overall direction is maintained, suggests a weaker, more indecisive trend. This nuanced understanding of trend strength is vital for managing risk and sizing positions appropriately.
Combining Renko with Other Indicators
While Renko charts are powerful on their own, their effectiveness can be further enhanced by combining them with other technical indicators. This synergistic approach allows traders to confirm Renko signals and gain additional insights into market momentum, volatility, and potential overbought/oversold conditions.
- Moving Averages: Overlaying moving averages on Renko charts can provide dynamic support and resistance levels. A cross of a shorter-term moving average above a longer-term one on a Renko chart, especially with a series of green bricks, can confirm a bullish trend.
- Relative Strength Index (RSI): The RSI can help identify overbought or oversold conditions within a Renko trend. Divergences between the RSI and Renko price action can signal potential reversals even before a brick color change.
- MACD (Moving Average Convergence Divergence): MACD can be used to gauge trend strength and momentum. A bullish MACD crossover coinciding with green Renko bricks reinforces the uptrend, while a bearish crossover with red bricks confirms a downtrend.
The key to successful integration is to use indicators that complement Renko’s strengths without introducing unnecessary complexity. The goal is to confirm, not confuse. By using these combinations, traders can build robust strategies that leverage the clarity of Renko charts with the added confirmation of traditional indicators. This dual approach can significantly improve the accuracy of trend identification and trade execution.
Ultimately, strategic trend identification with Renko charts, whether used in isolation or combined with other tools, empowers traders to make more informed and timely decisions in the US market. The clarity they offer is a significant asset in the pursuit of consistent trading success.
Renko Charts vs. Traditional Charting Methods
When delving into technical analysis, traders often encounter a myriad of charting methods, each with its own advantages and disadvantages. Renko charts stand out due to their fundamental difference from traditional charts like candlesticks or bar charts: their complete disregard for time. This distinction is not merely academic; it has profound implications for how market information is perceived and interpreted, especially in the fast-moving US market.
Traditional charts plot price movements against a fixed time interval – be it a minute, an hour, or a day. This means that every time period, regardless of the price action within it, will have a corresponding bar or candle. Consequently, periods of low volatility or consolidation can appear just as prominent as periods of strong trending, often cluttering the chart with insignificant data. This can make it challenging to identify the true underlying direction of the market.
Renko charts, on the other hand, are purely price-driven. A new brick is only drawn when the price moves a specified amount, filtering out all minor fluctuations and periods of sideways movement. This creates a much cleaner visual representation where trends are immediately apparent. A continuous series of bricks in one direction signifies a strong trend, while a change in brick color indicates a significant reversal. This stark contrast in construction offers a unique perspective that prioritizes clear trend visibility over the chronological progression of price.
Advantages and Disadvantages
Each charting method has its strengths and weaknesses. Understanding these can help traders choose the most appropriate tool for their specific analysis needs.
- Renko Advantages:
- Superior trend identification due to noise reduction.
- Clearer support and resistance levels.
- Easier to spot divergences and breakouts.
- Reduced emotional trading due to simplified visuals.
- Renko Disadvantages:
- Loses time information, which can be crucial for certain strategies.
- Can delay entry signals due to the brick formation requirement.
- Not ideal for strategies heavily reliant on time-based patterns or volatility measurement.
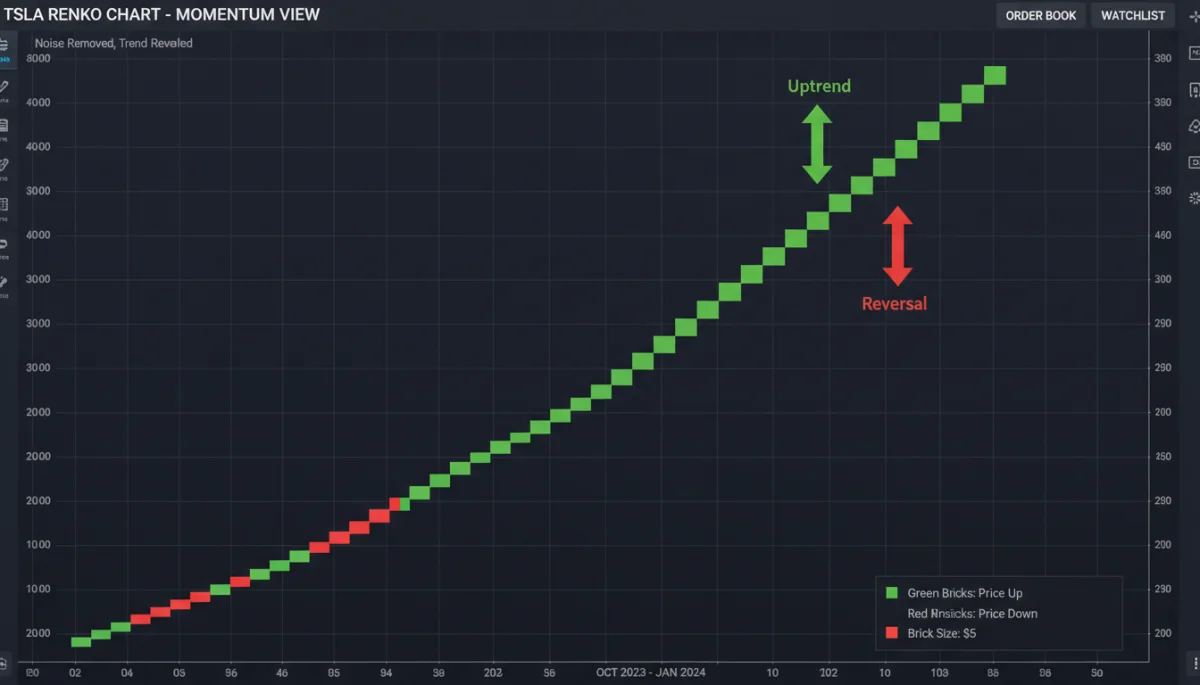
Traditional charts, while sometimes noisy, provide a complete picture of price, time, and volume (if included), which is essential for certain types of analysis, such as identifying time-based patterns or analyzing volatility within specific timeframes. However, their raw data presentation can be overwhelming and prone to generating false signals from minor price movements.
In conclusion, the choice between Renko and traditional charts often comes down to a trader’s primary objective. If the goal is to clearly identify and follow significant trends by filtering out market noise, Renko charts offer a distinct advantage. If time-based analysis and granular price action are paramount, traditional charts may be more suitable. Many experienced traders find value in using both, leveraging Renko for trend clarity and traditional charts for timing and detailed entry/exit points.
Implementing Renko Charts in US Market Trading
Implementing Renko charts effectively in US market trading requires a structured approach, combining a deep understanding of their mechanics with practical application strategies. The goal is to leverage their noise-filtering capabilities to enhance decision-making, leading to more consistent and profitable trades. The first step involves selecting the right brick size, as discussed earlier, which is paramount for tailoring the chart to specific assets and trading styles.
Once the brick size is established, traders can begin to use Renko charts for identifying entry and exit points. A classic strategy involves entering a long position when a series of green bricks appears after a period of red bricks, signaling a potential uptrend. Conversely, a short position can be initiated when red bricks follow green bricks, indicating a downtrend. The clarity of these signals makes them particularly appealing for trend-following strategies.
Risk management is also significantly streamlined with Renko charts. Stop-loss orders can be placed strategically below a series of bullish bricks or above a series of bearish bricks, aligning with the visually clear support and resistance levels that Renko charts tend to highlight. This brick-based approach to stop-loss placement can help in defining risk more precisely and adhering to a disciplined trading plan.
Practical Trading Strategies
Several practical strategies can be employed when using Renko charts for US market trading, each designed to capitalize on their unique properties.
- Trend Following: This is the most straightforward application. Enter when a new trend is confirmed by a series of same-colored bricks and stay in the trade until a reversal brick appears.
- Support and Resistance Breakouts: Renko charts often show cleaner support and resistance levels. Trading breakouts above resistance (with green bricks) or below support (with red bricks) can be highly effective.
- Divergence Trading: Combining Renko charts with oscillators like RSI or MACD can reveal divergences. A bullish divergence (price making lower lows on Renko, but indicator making higher lows) can signal an impending reversal to the upside.
For example, a trader might identify a strong uptrend in a tech stock using Renko charts, characterized by a continuous stream of green bricks. They could then use a moving average crossover on the Renko chart to confirm entries and exits, placing stop-losses a few bricks below the entry point. The absence of minor fluctuations on the Renko chart allows them to hold the position through small pullbacks that might otherwise trigger premature exits on traditional charts.
Another strategy involves looking for consolidation patterns, which appear as a series of alternating bricks within a tight range, before an eventual breakout. Renko charts make these consolidation zones very clear, and a breakout, confirmed by a new series of bricks in one direction, can signal a powerful move.
In essence, implementing Renko charts in US market trading empowers traders with a clearer, less noisy view of price action. By focusing on significant price movements, these charts facilitate more confident trend identification and offer a robust framework for developing and executing effective trading strategies.
Challenges and Considerations for Renko Users
While Renko charts offer significant advantages in simplifying market noise and identifying trends, traders must also be aware of the challenges and considerations associated with their use. No charting method is a panacea, and Renko charts have specific characteristics that, if not understood, can lead to suboptimal trading decisions. A critical aspect is the loss of time-related information, which can be a double-edged sword depending on the trading strategy.
The primary challenge stems from Renko’s time-independent nature. While it effectively filters noise, it also obscures how long it took for a particular price movement to occur. For strategies that rely on time-based patterns, such as those involving specific time-of-day volatility or expiration dates for options, Renko charts might not provide all the necessary data. This means traders might need to complement Renko analysis with traditional time-based charts for a complete market picture.
Another consideration is the potential for delayed signals. Because a new brick only forms after a specified price movement, Renko charts can sometimes generate entry or exit signals later than traditional charts. In fast-moving markets, this delay could mean missing the absolute beginning of a trend or exiting a position slightly later than ideal. The choice of brick size directly influences this delay; a larger brick size will lead to greater delays but also filter out more noise.
Mitigating Renko-Specific Risks
To maximize the benefits of Renko charts while minimizing their inherent risks, traders can employ several mitigation strategies.
- Dynamic Brick Sizing: Instead of a fixed brick size, using an adaptive measure like Average True Range (ATR) can help. An ATR-based brick size adjusts dynamically to market volatility, potentially reducing signal delays during highly volatile periods and filtering more noise during calmer times.
- Multi-Timeframe Analysis: While Renko charts are time-independent, they can still be used in conjunction with different timeframes from traditional charts. For instance, using a Renko chart for trend identification and a lower timeframe candlestick chart for precise entry timing.
- Confirmation with Other Indicators: As previously mentioned, combining Renko charts with momentum or volume indicators can provide additional confirmation for signals, reducing the likelihood of false signals due to the brick formation process.
One common pitfall is over-reliance on Renko signals without considering the broader market context. Even with a clear Renko trend, understanding economic news, earnings reports, or geopolitical events that could impact the US market remains crucial. Renko charts are a tool for technical analysis, not a replacement for fundamental understanding or comprehensive market awareness.
Furthermore, traders should be mindful of the psychological aspect. The clean appearance of Renko charts can sometimes lead to a false sense of security, making it seem as if trading is simpler than it is. It’s important to remember that market dynamics are complex, and Renko charts are merely a way to interpret price action, not to predict the future with absolute certainty.
In summary, while Renko charts are a powerful asset for simplifying US market noise and identifying trends, their effective use requires an understanding of their limitations. By acknowledging these challenges and implementing thoughtful mitigation strategies, traders can harness the full potential of Renko charts for more informed and robust trading decisions.
The Future of Renko Charts in US Market Analysis (2026 Outlook)
As we look towards 2026, the relevance and adoption of Renko charts in US market analysis are poised for significant growth. The increasing complexity and volatility of global financial markets, coupled with the proliferation of algorithmic trading, make the need for simplified, noise-filtered data more critical than ever. Renko charts, with their inherent ability to cut through the clutter, offer a compelling solution for traders and investors seeking a clearer edge.
The continuous evolution of trading platforms and analytical tools is likely to integrate Renko charts more seamlessly, making them accessible to a wider audience. Advanced features, such as dynamic brick sizing algorithms that automatically adjust to market conditions, will further enhance their utility. This technological integration will empower more traders to leverage Renko’s benefits without deep manual configuration, democratizing access to sophisticated trend analysis.
Furthermore, the drive for data efficiency and actionable insights will propel Renko charts into the mainstream. In a world awash with information, the ability to distill price action into clear, unambiguous trends is a distinct advantage. This focus on clarity will be particularly valuable in the US market, where rapid news cycles and high-frequency trading can often obscure fundamental price movements.
Anticipated Developments and Applications
- AI and Machine Learning Integration: Expect to see Renko charts being used as input for AI and machine learning models. The clean, discrete data points of Renko bricks are ideal for training algorithms to identify patterns and predict future trend directions with higher accuracy.
- Enhanced Backtesting Capabilities: Trading platforms will likely offer more robust backtesting environments specifically designed for Renko-based strategies, allowing traders to refine their approaches with historical data more effectively.
- Cross-Asset Analysis: While already applicable, Renko charts will see increased use in comparing trends across different asset classes within the US market, such as stocks, commodities, and indices, providing a unified view of intermarket relationships.
The emphasis on risk management will also highlight Renko charts. Their ability to clearly define support and resistance levels and signal trend reversals makes them an excellent tool for setting precise stop-loss and take-profit levels. This will become even more critical in an environment where capital preservation is paramount.
Moreover, educational resources and communities dedicated to Renko chart analysis are expected to expand, fostering a deeper understanding and wider adoption. As more traders share their successful Renko-based strategies, the collective knowledge base will grow, further solidifying their position as a valuable analytical tool.
In conclusion, the outlook for Renko charts in US market analysis by 2026 is exceptionally positive. Their unique ability to simplify market noise, combined with ongoing technological advancements and a growing appreciation for clear trend identification, positions them as an indispensable tool for traders and investors navigating the complexities of the modern financial landscape.
| Key Point | Brief Description |
|---|---|
| Noise Reduction | Renko charts filter minor price fluctuations, providing clearer trend visibility in the US market. |
| Trend Identification | They excel at highlighting sustained price movements, making trend beginnings and reversals easier to spot. |
| Brick Size Importance | Optimal brick size is crucial for balancing noise filtering and signal timeliness in analysis. |
| Future Outlook | Increasing integration with AI and enhanced platform features will boost Renko’s adoption by 2026. |
Frequently Asked Questions About Renko Charts
Renko charts are price-based charts that filter out time and minor price movements, drawing new ‘bricks’ only when the price moves by a specified amount. Unlike traditional charts, they focus solely on significant price action, offering a cleaner view of trends.
By only plotting price changes that meet a predefined ‘brick size,’ Renko charts effectively remove insignificant price fluctuations and sideways movements. This process reduces market noise, making underlying trends much clearer and easier to identify for traders.
The ‘brick size’ determines the sensitivity of the Renko chart to price movements. An optimal brick size balances noise reduction with signal timeliness, ensuring that the chart effectively highlights significant trends without excessive delays or over-filtering crucial information.
Absolutely. Renko charts can be effectively combined with indicators like moving averages, RSI, or MACD to confirm signals and gain additional insights. This synergistic approach enhances decision-making by leveraging Renko’s clarity with the confirmatory power of other tools.
Challenges include the loss of time-related information and potential for delayed signals due to the brick formation mechanism. Traders must understand these limitations and consider complementing Renko analysis with traditional charts or dynamic brick sizing for comprehensive insights.
Conclusion
In conclusion, Renko Charts: Simplifying US Market Noise for 20% Clearer Trend Identification in 2026 stands as a powerful and increasingly relevant tool for navigating the complexities of the US financial markets. By prioritizing significant price movements and filtering out the distracting noise inherent in traditional time-based charts, Renko charts offer unparalleled clarity in trend identification. While acknowledging their unique characteristics, particularly the absence of time information, their benefits in streamlining analysis and fostering disciplined trading are undeniable. As technology advances and market volatility persists, the strategic adoption of Renko charts, potentially integrated with AI and other indicators, will undoubtedly empower traders to make more informed decisions and achieve enhanced outcomes in the years to come.
