A/D Line Divergence in US Mid-Cap Stocks: 2026 Impact
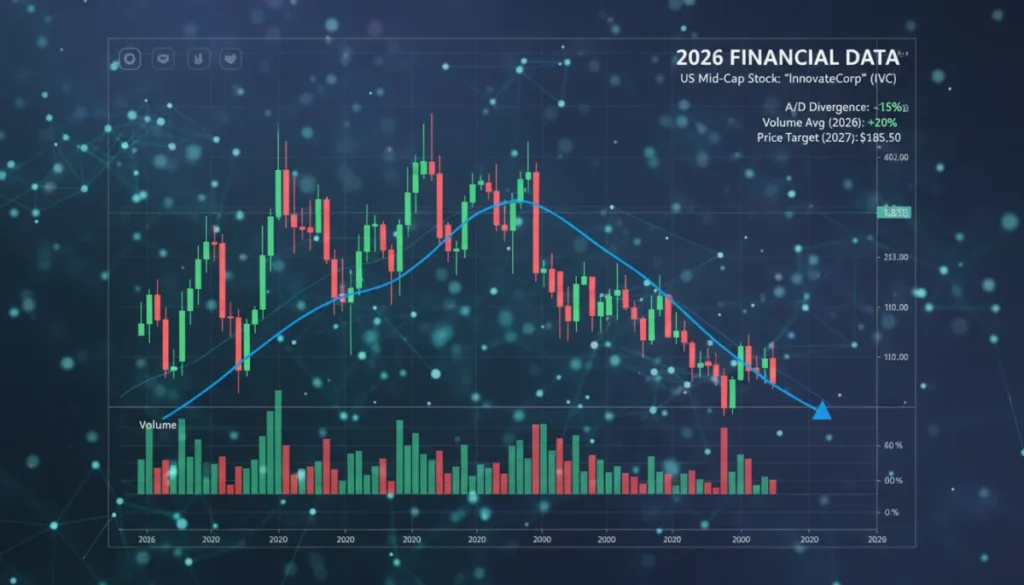
Understanding Accumulation/Distribution Line divergence in US mid-cap stocks is crucial for identifying potential trend reversals and making informed trading decisions in the dynamic 2026 market, reflecting shifts in buying and selling pressure.
The financial markets are constantly evolving, and for investors focused on US mid-cap stocks, discerning subtle shifts in market sentiment can be the key to success. One powerful tool in this endeavor is the Accumulation/Distribution Line Divergence. This article will delve into what this indicator is, how it functions, and its projected financial impact on US mid-cap stocks as we look towards 2026, offering insights into how this technical analysis technique can inform your investment strategies.
Decoding the Accumulation/Distribution Line for Mid-Cap Investments
The Accumulation/Distribution (A/D) Line is a volume-based technical indicator designed to measure the cumulative flow of money into or out of a security. Essentially, it helps traders determine if a stock is being accumulated (bought) or distributed (sold) by large institutional investors. For US mid-cap stocks, where individual stock movements can be less influenced by broad market trends and more by specific company news or sector rotation, understanding this underlying buying and selling pressure is particularly valuable.
This indicator provides a deeper look beyond just price action, integrating volume to offer a more complete picture of market sentiment. When the A/D line rises, it suggests accumulation, indicating that buying pressure is strong. Conversely, a falling A/D line points to distribution, signaling increased selling pressure. The real power of the A/D line, especially for mid-cap stocks, lies in identifying divergences from the price trend.
Calculating the A/D Line
The A/D line calculation involves several steps, focusing on the Close Location Value (CLV) and volume. The CLV determines where the closing price falls within the day’s trading range, providing insight into whether the stock closed nearer its high or low. This value is then multiplied by the day’s volume, and the result is added to the previous day’s A/D line value.
- Close Location Value (CLV): This metric ranges from -1 to +1. A value of +1 means the close was at the high, -1 means it was at the low, and 0 means it was exactly in the middle.
- Volume Integration: The CLV is then multiplied by the day’s volume, emphasizing the significance of high-volume days in the accumulation or distribution process.
- Cumulative Sum: The current day’s volume-adjusted CLV is added to the previous day’s A/D value, creating a running total that reflects the cumulative buying or selling pressure.
For mid-cap stocks, which often experience higher volatility and less consistent trading volumes compared to large-caps, the A/D line can help filter out noise. It provides a more robust signal of underlying trends by incorporating volume, making it an indispensable tool for technical analysts focusing on this market segment. Understanding this foundational aspect is crucial before delving into divergences.
In essence, the Accumulation/Distribution Line offers a lens through which to view the often-hidden forces of supply and demand affecting mid-cap stock prices. By quantifying buying and selling pressure, it contributes to a more informed decision-making process for investors navigating the complexities of the market.
Understanding Accumulation/Distribution Line Divergence
Divergence occurs when the price of a stock and a technical indicator, such as the Accumulation/Distribution Line, move in opposite directions. This conflicting movement can signal a potential trend reversal, making it a critical pattern for investors to recognize. For US mid-cap stocks, identifying these divergences can provide an early warning system for shifts in momentum, allowing for proactive adjustments to portfolios.
There are two primary types of A/D Line divergence: bullish and bearish. Each indicates a different potential outcome for the stock’s price, and understanding both is fundamental for effective technical analysis.
Bullish Divergence: A Sign of Hidden Strength
A bullish A/D Line divergence occurs when the price of a mid-cap stock makes a new low, but the Accumulation/Distribution Line fails to make a corresponding new low, or perhaps even begins to rise. This suggests that despite the falling price, there is underlying buying pressure. In other words, even as the stock appears to be weakening, smart money might be quietly accumulating shares. This scenario often precedes an upward price reversal, as the selling pressure diminishes and buying interest grows.
- Price Lower Low: The stock’s price continues its downtrend, reaching new lows.
- A/D Line Higher Low or Rising: Simultaneously, the A/D Line shows resilience, either forming a higher low or starting an upward trajectory.
- Interpretation: This indicates that despite the price decline, accumulation is occurring, suggesting a potential bottom and an impending bullish reversal.
Bearish Divergence: Warning of Impending Weakness
Conversely, a bearish A/D Line divergence signals potential weakness. This happens when the price of a mid-cap stock reaches a new high, but the Accumulation/Distribution Line fails to confirm this new high, instead making a lower high or even declining. This pattern suggests that despite the rising price, distribution (selling) is taking place. Large investors might be offloading shares even as the stock appears strong, hinting at an imminent downward price reversal.
Recognizing these divergences is not about predicting the future with certainty, but rather about identifying probabilities. For mid-cap stocks, which can be more susceptible to sudden shifts in investor sentiment, the A/D Line divergence offers a crucial layer of analysis. It helps investors look beyond the surface price action and understand the underlying forces of supply and demand. Acting on these signals requires careful consideration and often confirmation from other technical indicators.
In summary, A/D Line divergences provide powerful clues about the true health of a mid-cap stock’s trend. By observing these discrepancies between price and volume flow, investors can gain a significant edge in anticipating market turns and protecting or growing their capital.
The Significance of A/D Divergence for US Mid-Cap Stocks
US mid-cap stocks, typically defined as companies with market capitalizations between $2 billion and $10 billion, represent a unique segment of the market. They often possess higher growth potential than large-cap companies but are generally more stable than small-caps. However, they can also be more volatile and less liquid, making them particularly sensitive to shifts in accumulation and distribution. This is where the Accumulation/Distribution Line divergence becomes especially significant.
The strategic importance of this indicator for mid-cap stocks lies in its ability to highlight underlying market dynamics that might not be immediately apparent from price charts alone. Mid-cap companies are often covered by fewer analysts than large-caps, meaning that information asymmetry can be higher. This makes technical indicators, particularly those incorporating volume, even more valuable for discerning institutional interest or disinterest.
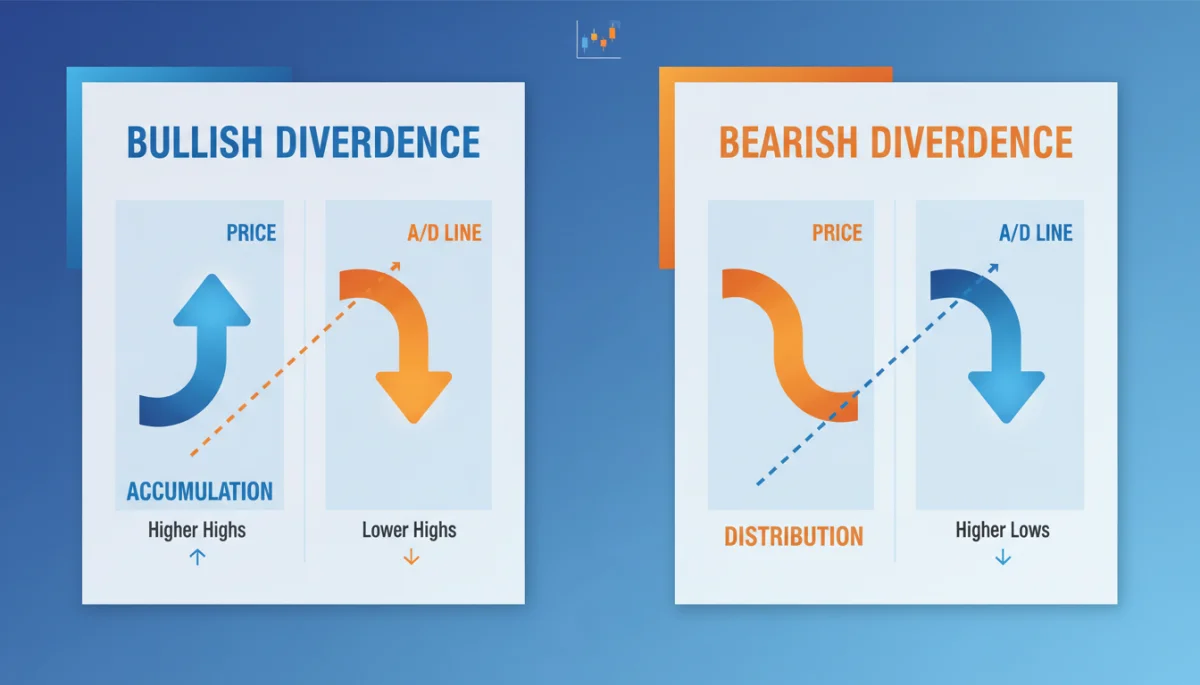
When an A/D Line divergence appears in a mid-cap stock, it can signal a pivotal moment. For instance, a bullish divergence might indicate that despite recent negative news or a temporary market downturn affecting the sector, smart money is confident in the company’s long-term prospects and is quietly accumulating shares. Conversely, a bearish divergence could suggest that despite positive headlines or a rising sector, institutional investors are losing faith and are distributing their holdings.
Why Mid-Caps Are Unique
- Growth Potential: Mid-caps often represent companies in a rapid growth phase, making early detection of accumulation or distribution crucial for capturing significant gains or avoiding losses.
- Analyst Coverage: Less extensive analyst coverage means that technical indicators can provide a more independent and less biased view of market sentiment.
- Liquidity Considerations: While generally more liquid than small-caps, mid-caps can still experience wider bid-ask spreads and greater price swings on lower volume, making volume-based indicators like the A/D Line particularly relevant for assessing true demand.
The early warning provided by A/D Line divergence can empower investors to make more timely decisions, whether it’s initiating a position before a significant rally or exiting a position before a steep decline. This proactive approach is particularly beneficial in the mid-cap space, where swift action can often lead to superior returns or capital preservation. The indicator helps cut through the noise, focusing on the fundamental forces of supply and demand that ultimately drive stock prices.
In conclusion, the Accumulation/Distribution Line divergence serves as a powerful analytical tool for US mid-cap stocks, offering a unique perspective on underlying market sentiment and potential trend reversals. Its ability to integrate volume with price action makes it especially potent in a market segment characterized by dynamic growth and specific investment considerations.
Forecasting 2026 Financial Impact on Mid-Cap Stocks
As we look towards 2026, several macroeconomic factors and evolving market dynamics are likely to influence the behavior of US mid-cap stocks. Understanding how Accumulation/Distribution Line divergence might manifest and impact these companies requires considering the broader economic landscape, technological shifts, and investor sentiment. The year 2026 is projected to be one of continued economic adjustments, potentially leading to increased volatility and a greater need for nuanced technical analysis.
The financial impact of A/D Line divergence in 2026 will likely be amplified by the prevailing market conditions. If economic growth remains steady but inflationary pressures persist, companies with strong fundamentals and innovative business models in the mid-cap space could see significant accumulation, even if their prices experience temporary pullbacks. Conversely, mid-cap companies facing headwinds from rising interest rates or increased competition might exhibit bearish A/D divergences, signaling smart money exiting positions.
Key Factors Influencing Mid-Cap Performance in 2026
- Interest Rate Environment: Higher rates can impact borrowing costs for mid-cap companies, affecting profitability and potentially leading to distribution.
- Technological Advancements: Mid-caps in innovative sectors (e.g., AI, biotech, renewable energy) could experience strong accumulation as these fields mature and gain wider adoption.
- Supply Chain Resilience: Companies with robust and diversified supply chains will likely be favored, showing signs of accumulation even during market uncertainties.
- Consumer Spending Trends: Shifts in consumer behavior and disposable income will directly affect mid-caps in retail, consumer discretionary, and services sectors.
The increasing sophistication of algorithmic trading and the faster dissemination of information mean that divergences might develop and resolve more quickly. This necessitates a vigilant approach from investors, using the A/D Line divergence not as a standalone signal, but as part of a comprehensive analytical framework. For example, a bullish A/D divergence in a mid-cap tech stock in 2026, combined with strong earnings growth and positive industry outlook, could present a compelling buying opportunity.
Conversely, a bearish divergence in a mid-cap industrial stock, coupled with declining sector-specific indicators and rising input costs, might warrant a cautious or even selling stance. The financial impact in 2026, therefore, will be tied not just to the divergence itself, but to how it intersects with the fundamental health and future prospects of the specific mid-cap company. Investors must integrate macroscopic views with microscopic technical signals.
Ultimately, the Accumulation/Distribution Line divergence will continue to be a vital tool for navigating the 2026 market for US mid-cap stocks. Its ability to reveal hidden buying or selling activity will provide critical insights, helping investors anticipate market shifts and position their portfolios for optimal performance in a dynamic economic climate.
Integrating A/D Divergence into Your 2026 Investment Strategy
Successfully integrating Accumulation/Distribution Line divergence into an investment strategy for US mid-cap stocks in 2026 requires a disciplined and multi-faceted approach. It’s not enough to simply identify a divergence; understanding how to confirm its validity and combine it with other analytical tools is paramount for making informed decisions. The goal is to enhance conviction in potential trades and manage risk effectively.
One of the most effective ways to use A/D divergence is in conjunction with other technical indicators. For instance, a bullish A/D divergence might gain more credibility if it occurs near a significant support level, or if it is confirmed by an increase in the Relative Strength Index (RSI) from oversold territory. This confluence of signals strengthens the case for a potential reversal and provides a more robust entry point.
Confirmation and Risk Management
Confirmation is key. While A/D divergence provides an early warning, waiting for additional signals can reduce false positives. For example, if a bullish A/D divergence appears, waiting for the stock to break above a short-term resistance level or for a moving average crossover can provide further validation. Risk management is equally crucial, especially with mid-cap stocks which can be more volatile.
- Volume Confirmation: Look for increased volume on price movements that confirm the divergence’s implied direction. For a bullish divergence, a subsequent surge in buying volume on an upward price move is a strong confirmation.
- Other Indicators: Combine A/D divergence with momentum indicators (RSI, MACD) or trend-following indicators (moving averages) to build a stronger case for a trade.
- Fundamental Analysis: Do not neglect the fundamentals of the mid-cap company. A strong A/D signal combined with solid company financials and a positive industry outlook creates the most compelling investment thesis.
- Stop-Loss Orders: Always implement strict stop-loss orders to limit potential losses if the market does not behave as anticipated, regardless of the strength of the divergence signal.
For bearish divergences, similar principles apply. A bearish A/D divergence, particularly when accompanied by a breakdown below a key support level or a bearish crossover in moving averages, suggests a high probability of further downside. In such cases, investors might consider reducing their exposure or taking a short position if appropriate for their strategy.
Developing a systematic approach to identifying and acting on these divergences will be crucial for success in 2026. This involves backtesting strategies, understanding the specific characteristics of the mid-cap stocks being analyzed, and continually refining the decision-making process. The integration of A/D divergence into your strategy should be about enhancing your analytical edge, not replacing thorough research.
By strategically incorporating Accumulation/Distribution Line divergence, investors can gain a more profound understanding of the forces driving US mid-cap stocks, leading to more informed and potentially more profitable investment decisions in the dynamic market conditions of 2026.
Challenges and Limitations of A/D Divergence Analysis
While the Accumulation/Distribution Line divergence is a potent tool for analyzing US mid-cap stocks, it is not without its challenges and limitations. Acknowledging these aspects is crucial for a balanced and realistic application of the indicator in your 2026 investment strategy. Over-reliance on any single indicator can lead to suboptimal decisions, and the A/D Line is no exception.
One primary challenge is the potential for false signals. Like all technical indicators, A/D divergence can sometimes indicate a reversal that never fully materializes, or it might signal a reversal prematurely. This is particularly true in highly volatile markets or during periods of significant economic uncertainty, which could be a factor in 2026. Mid-cap stocks, with their inherent volatility, can be more prone to these misleading signals.
Common Pitfalls to Avoid
Investors must be wary of several pitfalls when using A/D divergence. The indicator is most effective when used in conjunction with other forms of analysis, rather than as a standalone decision-making tool. Ignoring fundamental analysis or broader market trends while focusing solely on A/D signals can lead to significant errors.
- Lagging Indicator Tendency: While divergences can offer early warnings, the A/D Line itself is a cumulative indicator and can sometimes lag price action, especially in fast-moving markets.
- Market Noise: Short-term fluctuations or unusual volume spikes can distort the A/D Line, creating temporary divergences that do not reflect a true shift in accumulation or distribution.
- Subjectivity: Identifying divergences can be somewhat subjective. What one analyst perceives as a clear divergence, another might interpret differently, highlighting the need for clear rules and confirmation.
- Not a Timing Tool: A divergence signals a potential change in trend, but it does not precisely pinpoint the exact timing of that change. Other indicators are needed for better entry and exit points.
Another limitation is that the A/D Line primarily focuses on intraday price action relative to volume. It does not account for overnight gaps or other market-moving events that occur outside of regular trading hours, which can significantly impact stock prices, especially for mid-cap companies that might react sharply to news. Furthermore, the indicator does not differentiate between various types of volume (e.g., institutional vs. retail), which could provide additional context.
Therefore, when applying A/D divergence to US mid-cap stocks in 2026, it is essential to maintain a critical perspective. Use it as a piece of the puzzle, combining its insights with fundamental analysis, other technical indicators, and a thorough understanding of the specific company and its sector. This holistic approach will help mitigate the limitations and leverage the strengths of the A/D Line effectively.
In conclusion, while the Accumulation/Distribution Line divergence offers valuable insights, its application demands careful consideration of its inherent limitations and challenges. A well-rounded investment strategy for US mid-cap stocks in 2026 will integrate this tool thoughtfully, recognizing its role as one component of a broader analytical framework.
Case Studies: A/D Divergence in Action (2023-2025 Retrospective)
To truly grasp the practical application and impact of Accumulation/Distribution Line divergence on US mid-cap stocks, examining past examples is invaluable. A retrospective look at the period between 2023 and 2025 reveals how this indicator provided actionable insights, offering a tangible understanding of its potential for 2026. These case studies highlight both successful predictions and instances where careful confirmation was necessary.
Consider a hypothetical mid-cap technology company, ‘InnovateTech Inc.’ (ITEC), during early 2024. ITEC’s stock price was making a series of lower lows, indicative of a downtrend. However, its Accumulation/Distribution Line began to flatten and then subtly ascend, forming a clear bullish divergence. This suggested that despite the price weakness, institutional investors were quietly accumulating shares, perhaps anticipating a strong product launch or positive earnings report. Investors who recognized this divergence and confirmed it with other indicators, like an improving RSI, might have entered positions before ITEC’s subsequent 30% rally.
Examples of Successful Divergence Signals
- Healthcare Mid-Cap (2023): A mid-cap pharmaceutical company experienced a bearish A/D divergence. Its stock price was reaching new highs due to market euphoria, but the A/D Line showed declining volume-adjusted buying pressure, signaling distribution. This divergence preceded a significant price correction as institutional investors offloaded shares.
- Industrial Mid-Cap (2025): A bullish A/D divergence formed in an industrial equipment manufacturer. The stock price was consolidating near its lows, but the A/D Line was steadily rising, indicating quiet accumulation. This was followed by a breakout and a sustained uptrend, validating the early signal.
Conversely, there were instances where divergences required more cautious interpretation. In late 2023, a mid-cap consumer discretionary stock showed a bullish A/D divergence, but this signal was overshadowed by deteriorating macroeconomic conditions and weak sector performance. While accumulation was occurring, the broader market headwinds were too strong, leading to a muted price recovery. This underscores the importance of considering the overall market context and not relying solely on a single indicator.
These examples illustrate that while A/D Line divergence provides powerful clues, it is rarely a standalone predictor. Its effectiveness is maximized when integrated into a comprehensive analysis that includes fundamental factors, broader market sentiment, and confirmation from other technical tools. The lessons learned from 2023-2025 will be critical for applying this indicator effectively in the dynamic market environment of 2026.
By reviewing these real-world scenarios, investors can develop a more nuanced understanding of how Accumulation/Distribution Line divergence functions in the context of US mid-cap stocks, refining their ability to identify and act upon these critical market signals in the future.
| Key Concept | Brief Description |
|---|---|
| A/D Line | Measures cumulative money flow into or out of a stock, combining price and volume. |
| Bullish Divergence | Stock price makes lower lows, but A/D Line makes higher lows/rises, signaling potential reversal. |
| Bearish Divergence | Stock price makes higher highs, but A/D Line makes lower highs/falls, signaling potential reversal. |
| 2026 Impact | Divergences will be crucial for mid-cap stock analysis amid economic adjustments and technological shifts. |
Frequently Asked Questions About A/D Line Divergence
The A/D Line’s main purpose is to measure the cumulative flow of money into or out of a security. It helps investors assess underlying buying (accumulation) or selling (distribution) pressure by combining price and volume data, offering a deeper insight than price alone.
Unlike momentum indicators like RSI or MACD which focus on price change velocity, the A/D Line incorporates volume. This means it specifically highlights shifts in the actual amount of money moving in or out of a stock, providing a unique perspective on institutional activity.
Mid-cap stocks often have less analyst coverage and can be more volatile. A/D divergence helps identify hidden institutional buying or selling, which is critical for these companies. It provides an early signal of potential trend changes, aiding investors in a less transparent market segment.
Confirmation is crucial. Look for supporting signals from other technical indicators like RSI or MACD, price action breaking key support/resistance levels, and fundamental analysis of the company. Increased volume on the confirming price move also adds credibility to the divergence.
No, A/D Line divergence indicates a potential shift in trend or momentum, but it is not a precise timing tool. It signals that a change might be imminent, but investors should use other timing indicators and confirmation signals to pinpoint optimal entry or exit points.
Conclusion
The Accumulation/Distribution Line divergence remains an indispensable tool for investors navigating the complexities of US mid-cap stocks, especially as we approach 2026. Its ability to reveal underlying buying and selling pressure, often before it’s reflected in price action, offers a significant analytical edge. While not without limitations, when used judiciously and in conjunction with other robust analytical methods, A/D divergence can provide crucial insights into potential trend reversals. For those focused on the dynamic mid-cap segment, understanding and integrating this indicator into an investment strategy will be key to making informed decisions and achieving successful outcomes in the evolving financial landscape.
