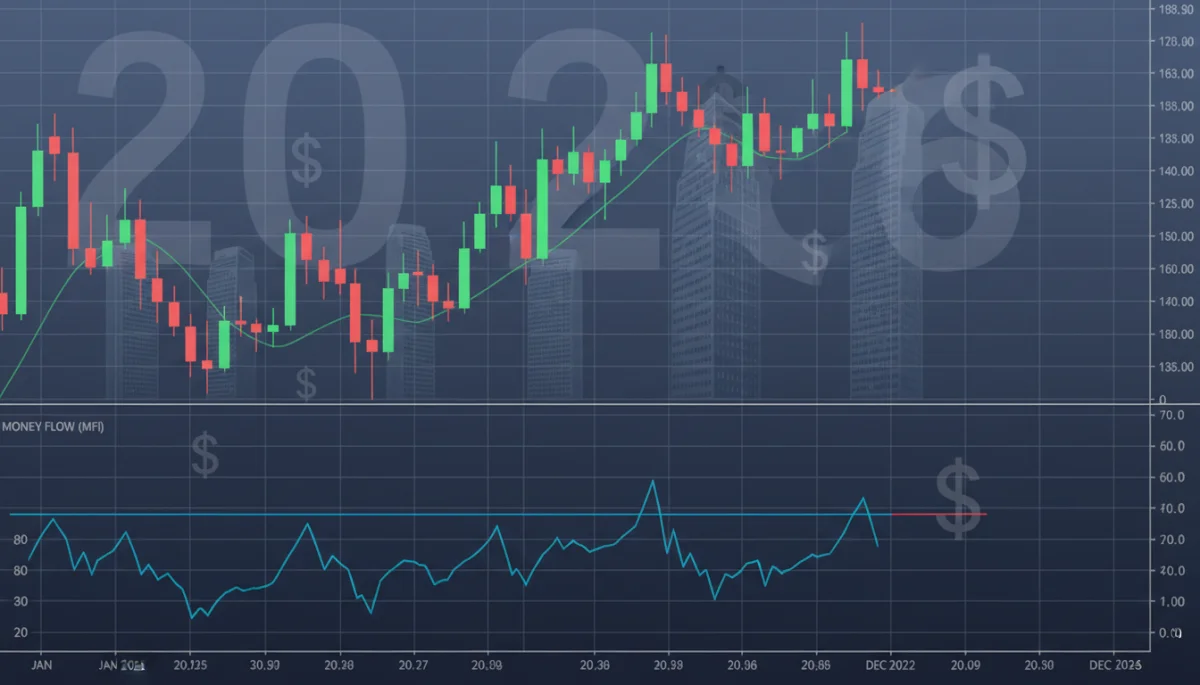
MFI: Spotting Institutional Accumulation in 2026 US Equities
The Money Flow Index (MFI) is a crucial technical indicator for discerning institutional accumulation in 2026 US equities, offering insights into potential price movements based on money flow volume.

US Market Shifts Q1 2026: Key Candlestick Patterns for Timely Trades
This article explores the five crucial candlestick patterns signaling US market shifts in Q1 2026, providing a practical framework for traders to execute timely and profitable trades.

2026 Guide to Bollinger Band Squeezes: US Market Breakouts
This guide provides a comprehensive overview of how to leverage Bollinger Band Squeezes for identifying and capitalizing on significant market breakouts in the US stock market during 2026, offering crucial insights for traders.